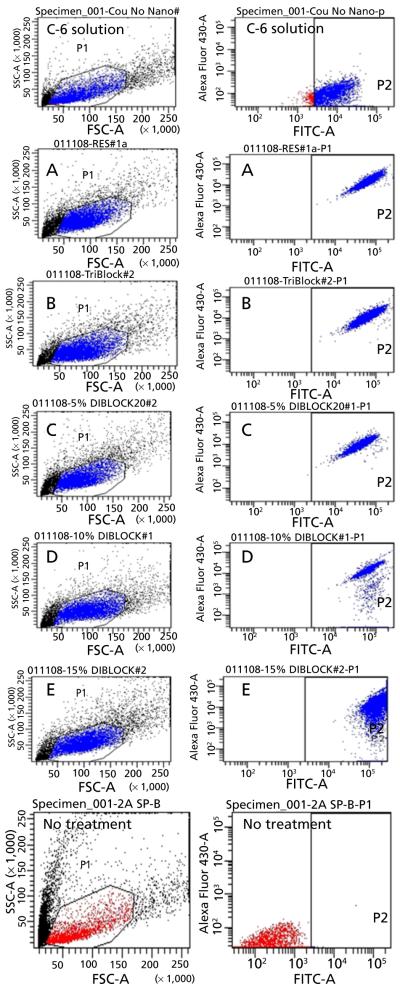
Figure 4.
Results of flow cytometry analysis (FACS) of the 4T1 breast cancer cells 24 h post treatment represented in dot plot graphs. Each graph represents the two gated channels, P1 and P2. The P1 channel shows gating of FSC (forward scatter) vs SSC (side scatter) dot plot. This plot can differentiate between the number of viable and apoptotic cells. Each measurement was repeated three times and the number of events per reading is 10 000. The P2 axes represent fluorescence intensity in log scale. The P2 channel represents viable cells with fluorescence signal and each dot represents single cell in the population. The P2 channel also indicates the total percentage of cell population picking up fluorescence signal. C-6: Treatment group, solution; A-E: Treatment groups, nanoparticles A-E; No treatment group: Control.

