
Figure 5.
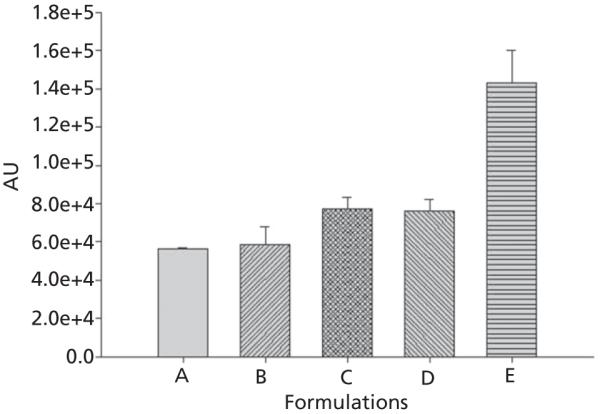
Flow cytometry analysis of the cells treated with the formulations A, B, C, D and E. The intensity of fluorescence was measured as A.U. The fluorescence intensity was quantified at 405–488 nm (FITC) excitation wave lengths. Each bar represents the mean of fluorescence intensity of triplicate samples ± SD.