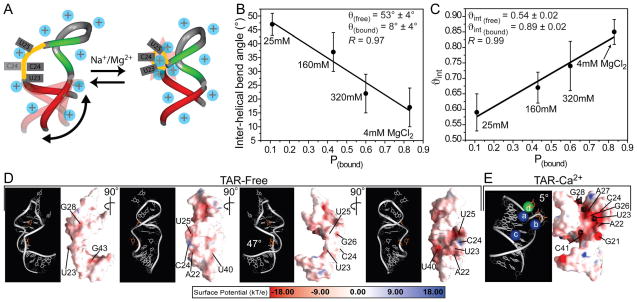
Figure 5.
(A) Two-state model for the metal-induced TAR structural transition. (B–C) Fitting of the observed (B) inter-helical bend angle (θ(obs)) and (C) amplitude of inter-helical motions (ϑint(obs) as a function of the fractional bound populations (pbound) using Equation 2. The “free” and “bound” θ and ϑint values obtained from the fit are shown together with the correlation coefficient (R). (D–E) Electrostatic surfaces for TAR (D) in “free” form (PDB ID#1ANR) (19) under moderate ionic strength conditions (50mM NaCl and 5mM phosphate buffer) with different views showing the weaker electrostatic potential and (E) bound to Ca2+ cations (PDB ID#397D) (20) with residues undergoing the largest metal-induced chemical shift perturbations highlighted.

