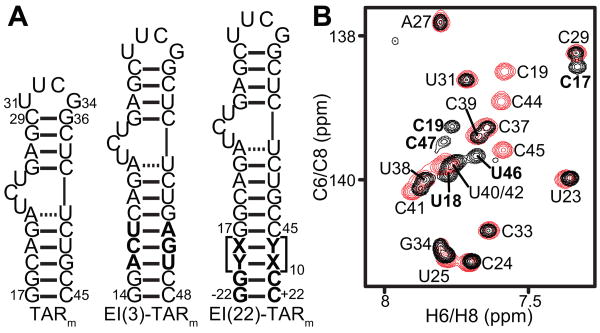
Figure 1.
TARm constructs. (a) Secondary structures of TARm, EI(3)-TARm, and EI(22)-TARm. Differences between constructs are shown in bold. (b) 2D 1H-13C HSQC spectrum of EI(3)-TARm (black) overlaid on the corresponding spectrum of TARm (red). TARm resonances are labeled in black, while peaks that belong only to EI(3)-TARm are shown in bold. All EI(3)-TARm experiments were conducted in NMR buffer (15 mM sodium phosphate, 25 mM sodium chloride, 0.1 mM EDTA and pH 6.4) at 298 K on an Avance Bruker 600 MHz NMR spectrometer equipped with a triple-resonance 5 mm cryogenic probe. 1H, 13C, and 15N resonances were assigned by spectra overlay [29,43] and using standard homonuclear and heteronuclear 2D experiments, including an exchangeable NOESY and a 2D HCN experiment that correlates intranucleotide H8/H6 to N1/N9 to H1′.

