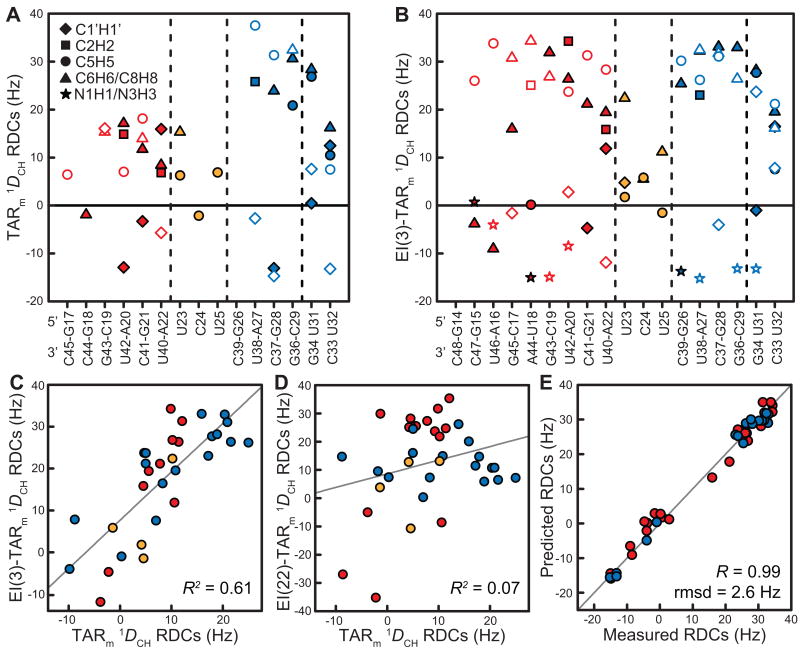
Figure 2.
Measurement of RDCs in EI(3)-TARm. One bond RDCs (1DCH and 1DNH) measured in (a) TARm and (b) EI(3)-TARm as a function of residue/secondary structure. Filled and open circles represent RDCs measured on the 5′and 3′ strand, respectively. RDCs have been normalized to those of EI(3)-TARm by the ratio of the ϑII values of EI(3)-TARm and TARm. See inset in Figure 2a for key. (c-d) Correlation plots between (c) TARm and EI(3)-TARm and (d) TARm and EI(22)-TARm RDCs. (e) Comparison of EI(3)-TARm RDCs measured in helix I (red) and helix II (blue) with values back-predicted using the best-fit order tensor and an idealized A-form helix and X-ray structure of the loop.

