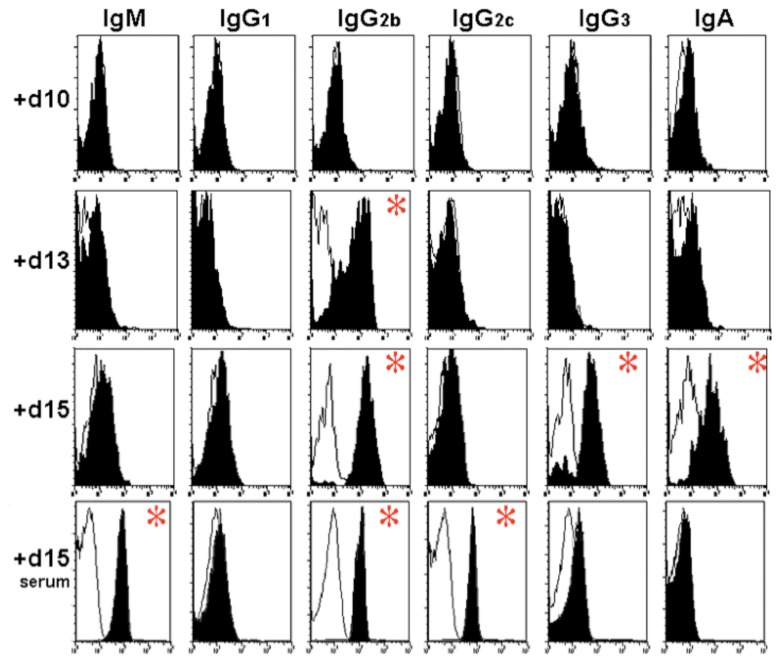
Fig. 3.
Ig Binding to fecal bacteria during infection: Representative histograms from flow cytometry of GFP+ events in fecal bacteria isolated from mice at 10, 13, and 15 days of infection with C. rodentium. X-axis indicates fluorescence intensity in FL-2 (log10 scale); Y-axis indicates number of events. Panels: Staining in control antibody-deficient JhD–/– mice mice (white tracings) are shown. From left to right, the different antibodies are shown (IgM, IgG1, IgG2b, IgG2c, IgG3, and IgA). The three top rows indicate levels in the fecal pellets 10, 13, and 15 days after infection. The bottom row shows antibody levels in serum 15 days after infection. Asterisks indicate a significant difference between wildtype and immune compromised mice

