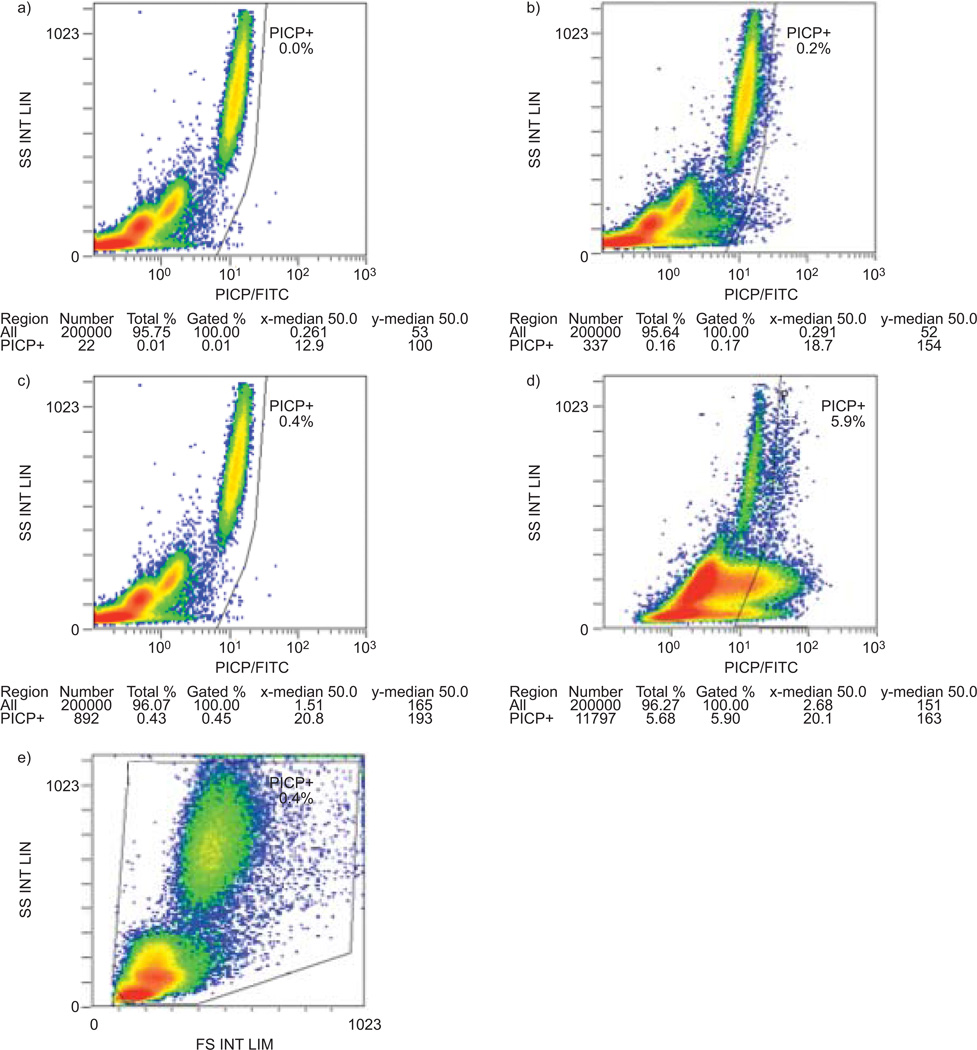
FIGURE 1.
Representative flow cytometric analysis for circulating CD45+/procollagen I C-terminal peptide (PICP)+ cells in controls and pulmonary hypertension (PH) patients. a) CD45/Pacific Blue (PB) versus intracellular isotype control/fluorescein isothiocyanate (FITC) analysis on blood from a representative normal subject. This control was used to set the negative gates. b) CD45+/PICP+ cells in normal blood. x axis: procollagen stained with goat anti-rabbit-FITC secondary antibody. c) CD45/PB versus intracellular isotype control/FITC analysis on blood from a patient with PH. This control was used to set the negative gates for the PH sample, same axes as in panel a. d) CD45+/PICP+ cells in PH blood, same axes as in panel b. e) Side scatter (SS) versus forward scatter (FS) analysis of buffy coat cells from the sample in panel d).

