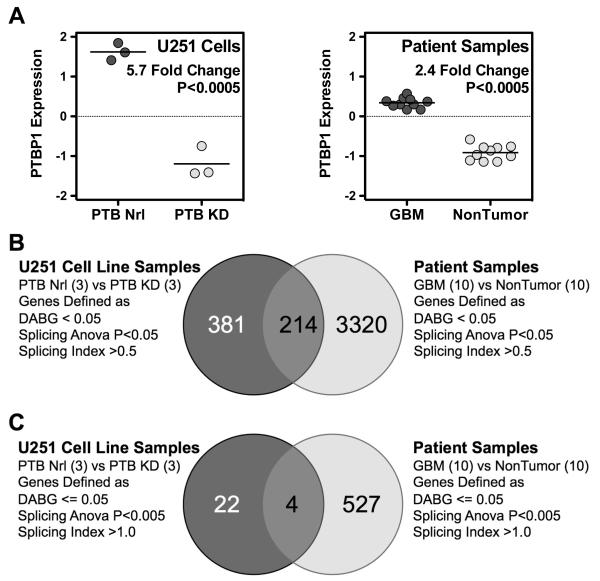
Figure 1.
Identification of PTBP1-mediated RNA splicing targets. (A) PTBP1 expression levels derived from Affymetrix exon array data. Left graph displays values for U251 GBM cells treated with control (PTB Nrl) or knockdown (PTB KD) morpholinos. Right graph shows the PTBP1 expression values for the 10 GBM samples and 10 nontumor samples used in this study. (B) and (C) Venn diagrams depicting the statistical derivation of genes with PTBP1-mediated changes in splicing. Datasets defined in (A) were used to derive PTBP1 target genes as defined by the indicated GeneSpring GX statistical parameters.

