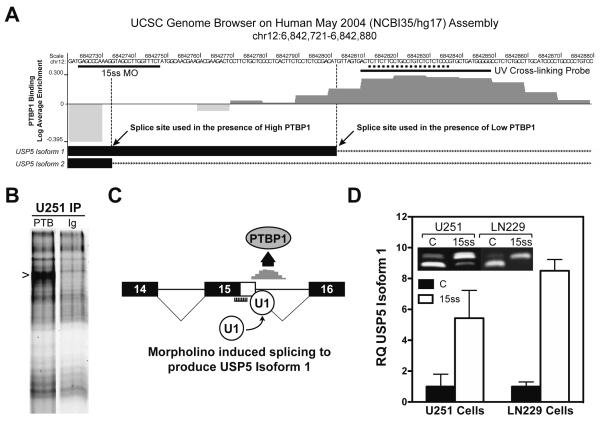
Figure 4.
Identification of PTBP1-binding sites and modulation of USP5 RNA splicing. (A) Schematic representation of SELEX-derived PTBP1-binding sites using HeLa cell nuclear extract within the USP5 alternatively regulated region [38]. The graph displays sequences found enriched (dark grey) or underrepresented (light grey) when examined for PTBP1 binding. The peak PTBP1-binding region maps from 6842820 to 6842829. PTBP1 binding is distinctly absent from the USP5 isoform 2 5′ splice site region. The UCSC Browser download for the genomic region indicated was modified to include only relevant information. The hybridization sites for the morpholino oligonucleotides and the sequence used to generate the UV cross-linking probe used in (B) are indicated. (B) UV cross-linking of U251 cell lysate with USP5 intron 15 IR800-endlabeled probe. Cross-linked complexes were immunoprecipitated (IP) with PTBP1 antibody (PTB) or antimouse immunoglobulin antibody (Ig), separated by SDS polyacrylamide gel electrophoresis and visualized by IR scanning. The PTBP1-specific band is noted. (C) Schematic illustration of the predicted outcome derived from the hybridization of 15 ss morpholino to USP5 precursor RNA. (D) Quantitative and semiquantitative (inset) RT-PCR analysis of U251 and LN229 GBM cells treated with control (C) or 15 ss morpholino.

