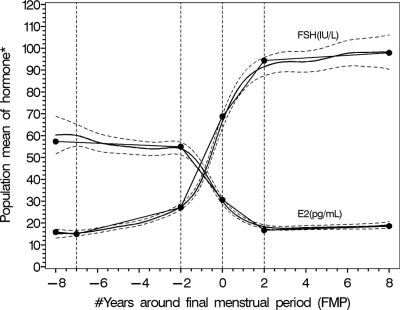
Fig. 1.
Adjusted population means (95% CI) for segmented mean profiles of follicle-stimulating hormone and estradiol across the final menstrual period in the Study of Women's Health Across the Nation (N = 1,215). *The y axis is unitless. The units of hormone are marked in the corresponding curves. Reproduced with permission from Randolph et al, J Clin Endocrinol Metab 2011;96:746–754.

