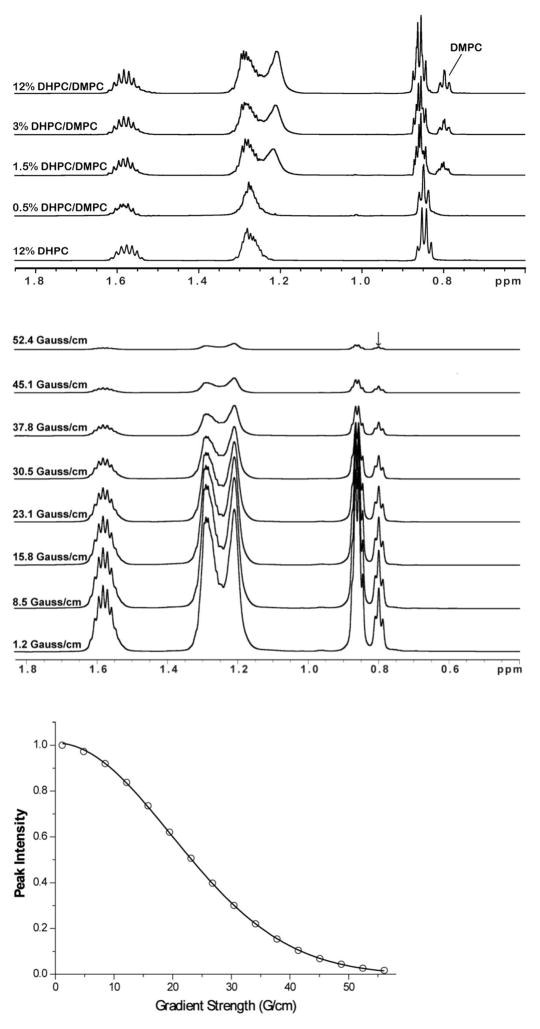
Figure 2.
(Top) 1H NMR spectra of q = 0.3 D6PC-DMPC bicelles at different total amphiphile concentrations and 303 K. The bottom spectrum shows a D6PC-only sample, which provides the basis for distinguishing DMPC peaks from D6PC peaks. These spectra include DMPC peaks at 0.8 and 1.2 ppm that broaden beyond detectability when the isotropic bicellar phase is lost upon dilution to below 1%. The gradient strength-modulated intensity of the DMPC peak at 0.8 ppm was measured as the basis for diffusion coefficient measurements. (Middle) Modulation of 1H NMR DMPC methyl peak intensity as a function of the gradient strength (as shown, in Gauss/cm) when the bipolar-gradient based diffusion-ordered spectroscopy (DOSY) experiments. The sample is the 12% case described for the top panel. (Bottom) Modulation of the DMPC methyl peak intensity as a function of gradient strength and fit of equation 1 to the data determine the translational diffusion coefficient. The sample is the 12% case described for the top panel.

