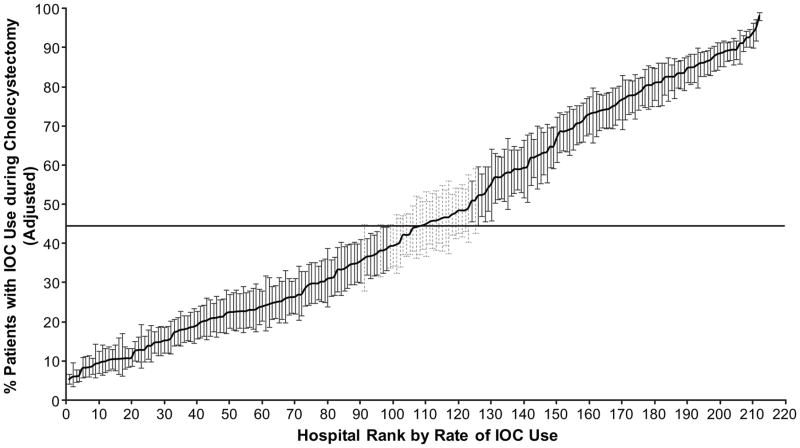
Figure 3.
Rates of IOC based on the 2-level hierarchical model. Rates of IOC use for 212 hospitals (>160 cholecystectomies) by rank, from lowest to highest IOC use, from 2001 through 2008. The rates were calculated by use of hierarchical generalized linear modeling (2-level), adjusted for patient characteristics. This model also accounts for differences in reliability of individual rates resulting from variations in the size of the panel of patients for each hospital. Each hospital-specific rate was adjusted toward the mean of the overall rate as a factor of panel size (i.e., a hospital with a large number of patients will result in very little adjustment toward the mean rate, whereas a hospital with a small number of patients will have more adjustment). The horizontal line represents the overall mean rate of IOC use. Error bars represent 95% confidence intervals for the IOC rates of individual hospitals. Black error bars represent hospitals that have rates statistically significantly (p<0.05) above or below the mean rate (44.5%) and light gray barsrepresent rates that are not different from the mean rate.

