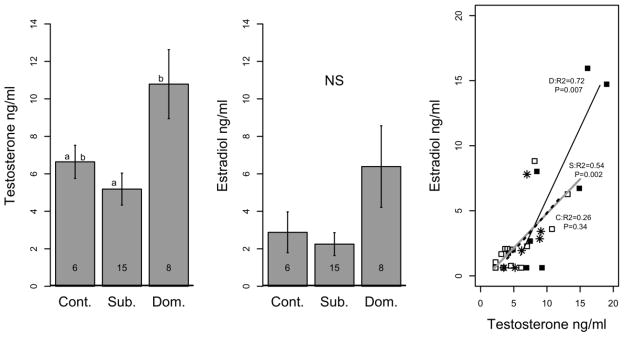
Figure 4. Hormone levels in female phenotypes.
Circulating levels (mean ± SE error) of testosterone (A) and estradiol (B) are shown. Numbers indicate sample sizes, letters indicate statistically significant differences (p < 0.05). (C) Correlation between steroid titers for individuals of each phenotype. Regression coefficients and p-values are given for D:dominant (black line), S:subordinate (gray line), and C:control (dashed line) female.

