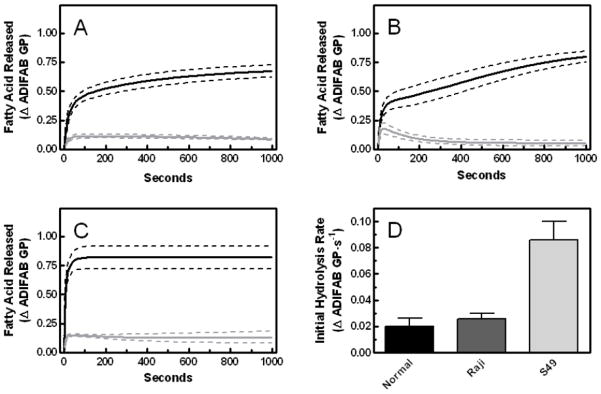
Fig. 3.
Membrane hydrolysis by sPLA2 assayed by ADIFAB fluorescence. Cells were treated with ionomycin (black) or DMSO (gray) for 10 min and then with sPLA2 (time 0 on the graphs). Hydrolysis of normal lymphocytes (A), Raji cells (B), and S49 cells (C) was assayed using ADIFAB, and the experimental data were averaged to create a composite representation of the time profile for each cell type. Dotted lines indicate the range of ± one SEM for 3–9 independent samples. Panel D: The maximum rate of hydrolysis during the first 12 s after sPLA2 addition was calculated from the data of ionomycin-treated samples in panels A–C. One-way analysis of variance followed by a Bonferroni post-test revealed that these rates were statistically greater for S49 cells compared to the other cell types (p < 0.001), which were indistinguishable from each other.

