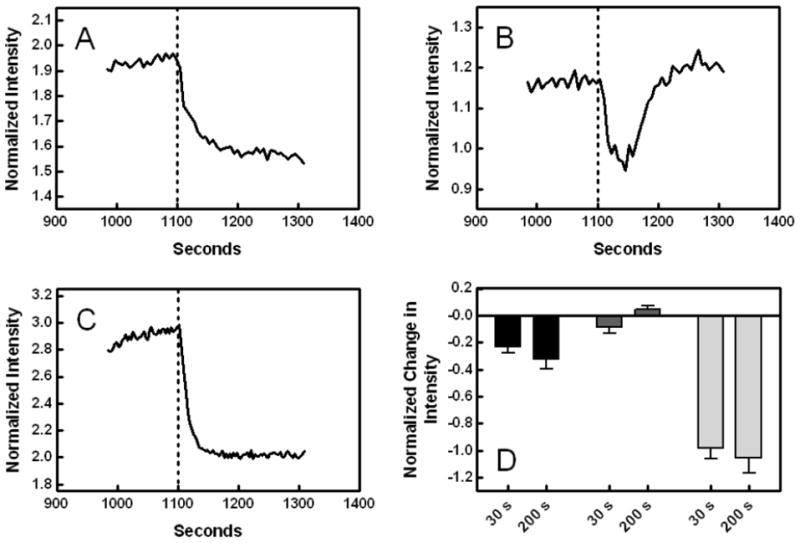
Fig. 6.

Effect of initial membrane hydrolysis on MC540 fluorescence intensity in ionomycin-treated samples. The fluorescence intensity of MC540 for normal lymphocytes (A), Raji cells (B), and S49 cells (C) was measured over time following addition of ionomycin. The data were normalized to the intensity prior to addition of ionomycin, and the traces shown in the figures begin approximately 600 s after that addition. Secretory PLA2 was added at the dotted lines. Panel D: The change in intensity at 30 s and again 200 s after addition of sPLA2 was calculated for each cell type (normal lymphocytes, black; Raji, dark gray; S49, light gray) as explained in the legend to Fig. 5. Only the effects of cell type (90.9% of the variation) were significant (p ≤ 0.0001) by two-way analysis of variance (n = 2–6). A Bonferroni post-test revealed that every pair-wise comparison between cell types at the 200 s time point was significant (p < 0.001), and that the 30 s point was indistinguishable between Raji and normal lymphocytes but different for S49 cells (p < 0.001).
