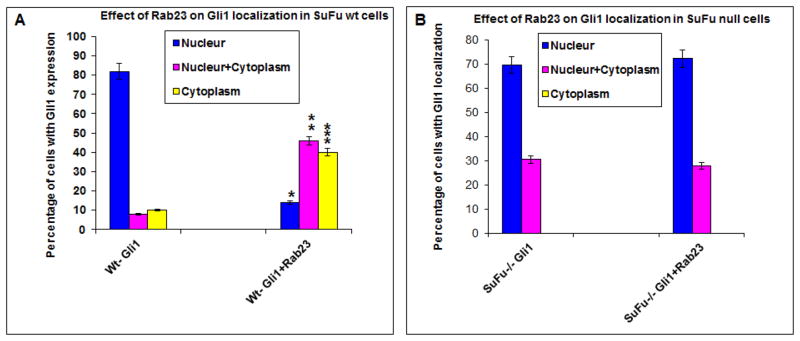
Fig. 6. Regulation of Gli1 nuclear localization.
Gli1 nuclear localization was detected by immunofluorescent staining after transfection with Gli1 and Rab23 in either wild type cells (A) or Su(Fu) null cells (B, Fig. S2). The detailed procedure was described in Methods and in previously published paper (15). The percentage of cells with nuclear (N), both nuclear and cytoplasm (N/C), and cytoplasm (C) Gli1 staining was calculated from the positively stained cells (n>50), and the experiments were repeated three times with similar results. The differences in Gli1 cellular localization between Gli1 transfected cells and Gli1+Rab23 transfected cells were analyzed by student’s t test in each category (N, N/C and C separately), and the p values are 0.0001 (indicated as * for nuclear localization), 0.012 (indicated as ** for nuclear and cytoplasmic localization) and 0.023 (indicated as *** for cytoplasmic localization). P values below 0.05 were regarded as statistically significant. In Su(Fu) null cells, the p values are 0.8 for both nuclear Gli1 and nuclear/cytoplasmic Gli1.

