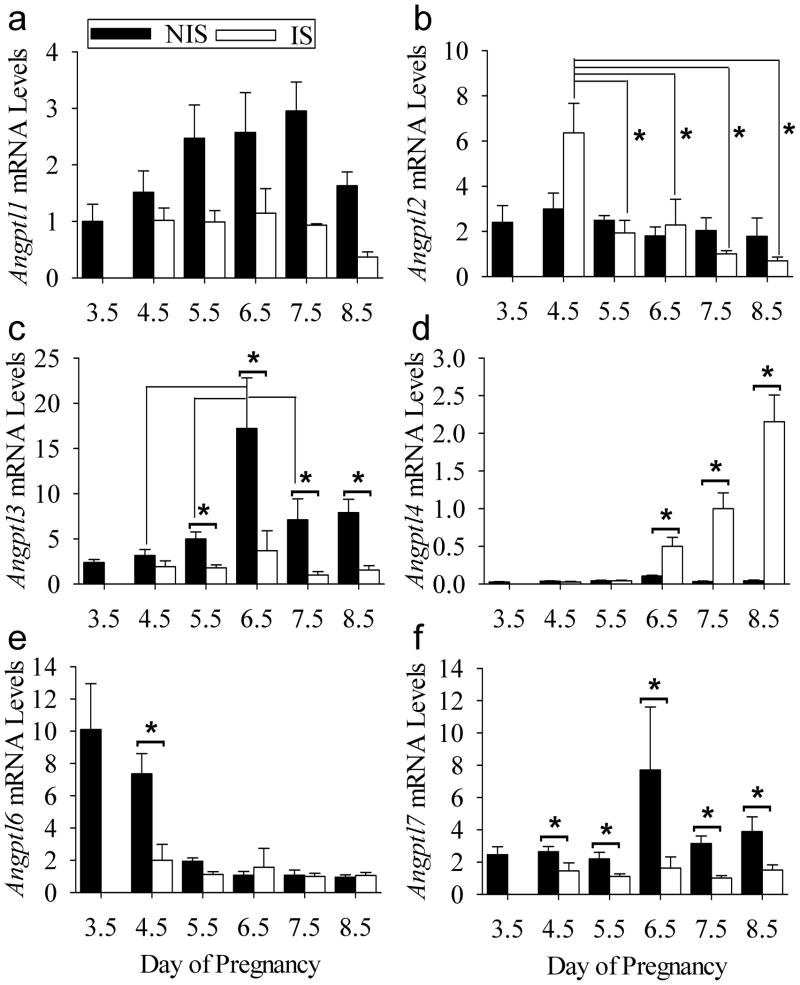
Figure 1.
qRT-PCR analysis of angiopoietin-like expression in the mouse uterus during implantation. Relative (A) Angptl1, (B) Angptl2, (C) Angptl3, (D) Angptl4, (E) Angptl6 and (F) Angptl7 mRNA levels in non-implantation (NIS) compared to implantation (IS) site tissue segments on Day 3.5–8.5 of pregnancy. Bars represent mean ± SEM (N=4). *P<0.05. The data were normalized to the mean relative mRNA level of Day 7.5 IS tissue.

