
Figure 2. Adjusted associations of baseline body mass index with baseline calf muscle characteristics among men and women with PAD (n=425)**.
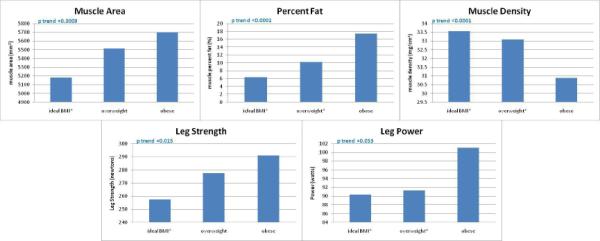
**Data are adjusted for age, race, gender, ABI, smoking, comorbidities, activity level and tibia length (muscle area and knee extension measures only). BMI categories were defined as ideal (BMI 20-25 kg/m2), overweight (BMI >25-30 kg/m2) and obese (BMI >30 kg/m2). * significant pair-wise comparison with obese BMI category. Pair-wise p-values were <0.001 (percent fat, muscle density), 0.0009 (muscle area), 0.014 (isometric knee extension strength), 0.048 (knee extension power).
N=412 for muscle area, percent fat, muscle density analyses. N=313 for leg strength analysis.
N=384 for leg power analysis.