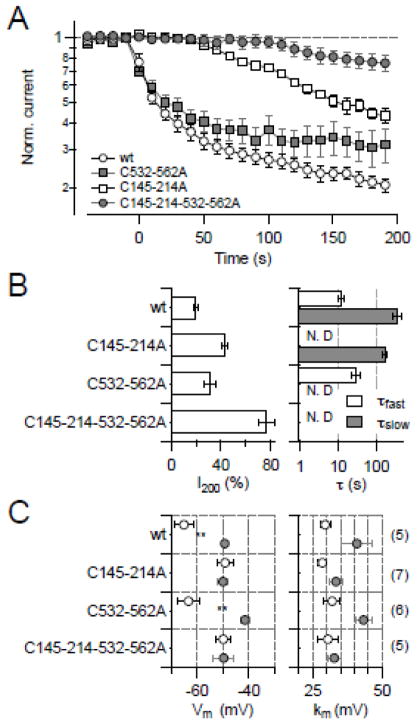
Fig. 5.
Identification of cysteine residues taking part in KCNH1 regulation. (A) Normalized current on a logarithmic scale for the indicated KCNH1 constructs at 40 mV with DTNB application (20 μM) at time zero. (B) Analysis of the mean remaining current after 200 s DTNB application (I200, left) and up to two time constants of current reduction (right). (C) Analysis of voltage-dependent activation (Vm, left; km, right) for the indicated mutants before (open circles) and after application of 20 μM DTNB (gray). All data are means ± SEM with n indicated in parentheses. “N.D.” denotes cases in which the corresponding exponential component was not present and, hence, was not determined.

