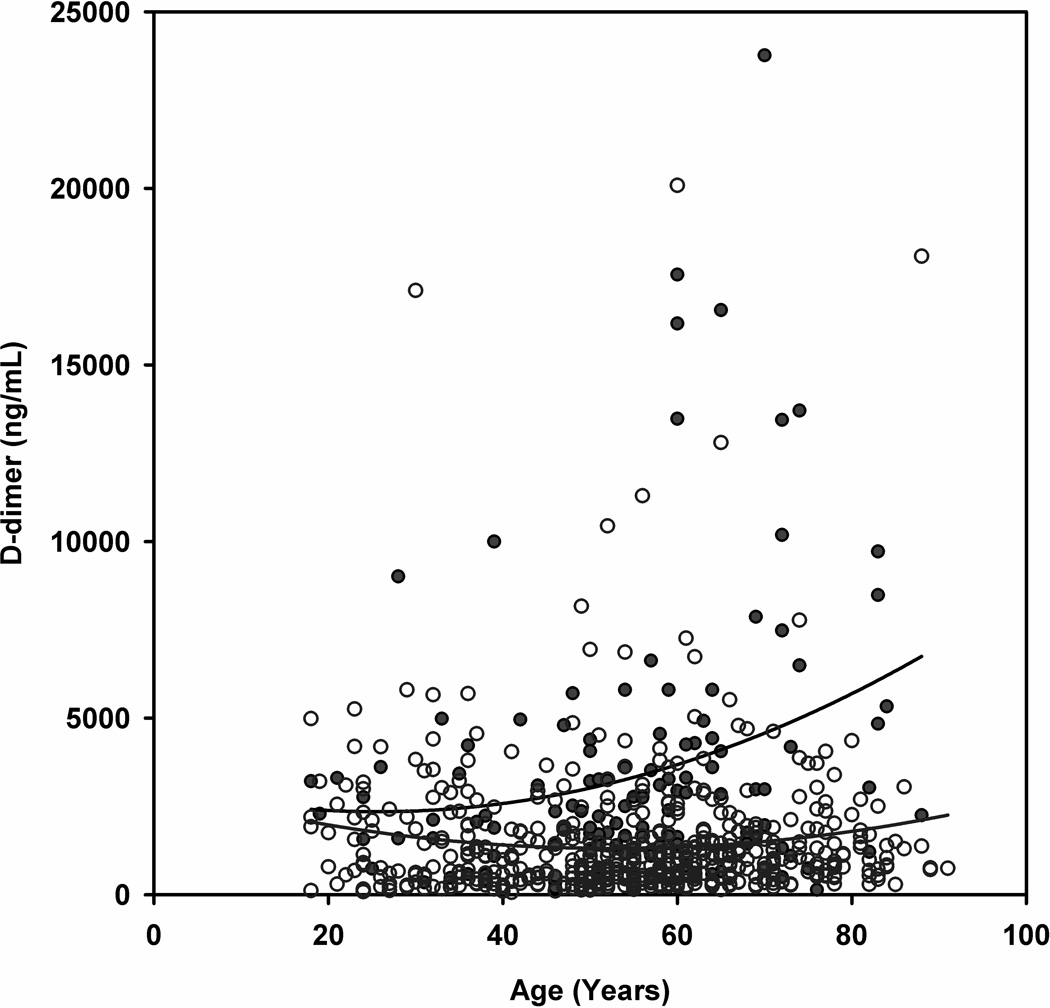
Figure 2.
Scatter plot of the plasma D-dimer concentration versus patient age for patients. Red circles represent PE+ patients and open blue circles represent PE− patients. The curved lines are best fit quadratic equations (PE+: D-dimer = 3096 - 58*age +1.13*age2; PE-: D-dimer = 3052 – 66*age +0.63*age2)

