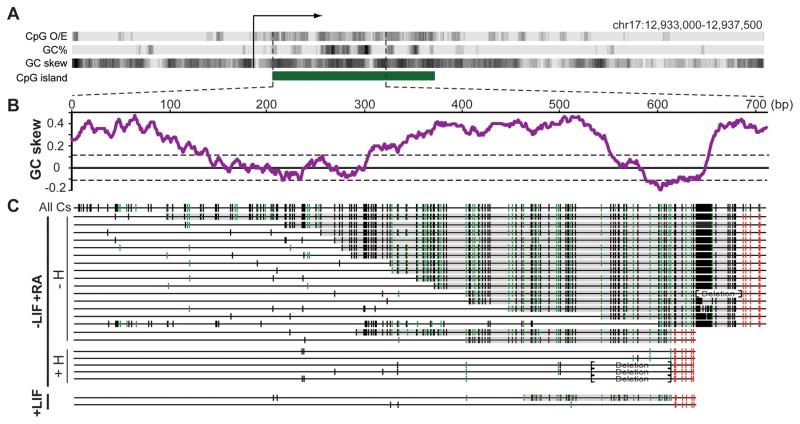
Figure 4. Formation of genomic R-loops at the endogenous mouse Airn CGI promoter.
A Schematic description of the 4.5 kb region surrounding the Airn promoter. B GC skew over the analyzed region. C Analysis of R-loop-derived ssDNA footprints. Symbols are as in Figure 2 except each line corresponds to one individual DNA molecule. DNA was analyzed from mESCs differentiated along a neural path by addition of retinoic acid (−LIF+RA, high Airn expression) with (+H) or without (−H) RNase H pre-treatment prior to bisulfite footprinting. Amplicons were also recovered from undifferentiated mESCs (+LIF, little to no Airn expression). Brackets indicate regions that underwent short deletions due to instability of the DNA sequence in E. coli.

