
Fig. 4.

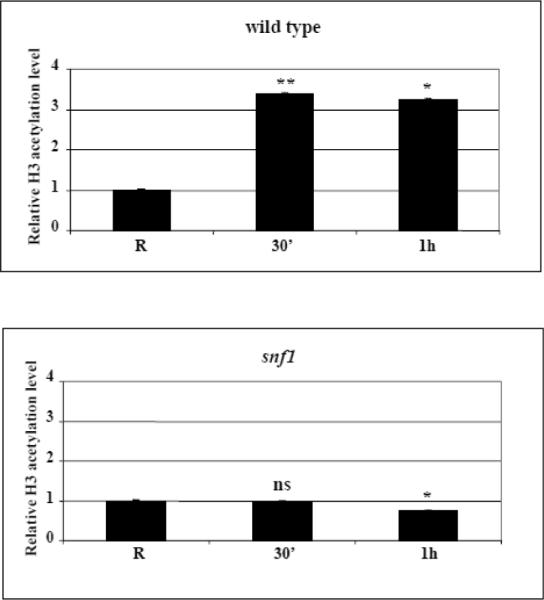
Kinetics of increase in histone H3 acetylation levels at the ADY2 promoter in wild type and mutant strains. (A) Chromatin immunoprecipitation was performed on wild type (CKY19–1), adr1 (CKY13–1), cat8 (CKY15–1) and adr1 cat8 (CKY23–1) mutant strains. Cells were collected in repressing conditions (R = 3% glucose) and at 30 min and 1 h after the shift to derepressing conditions (0.05% glucose). Cross-linked protein–DNA complexes were immunoprecipitated using antibody against acetylated lysines K9 and K14 of histone H3. Control material was without antibody (No Ab). DNA was amplified by real-time PCR using primer pairs as described in Material and methods. A primers pair for ACT1 promoter was used as control. The acetylation value of ADY2 promoter obtained by RT-PCR was corrected subtracting first the No Ab value, and then the input value. The same elaboration was performed for ACT1 used as reference gene. The final value of ADY2 acetylation level was calculated subtracting ACT1 value from ADY2 value. Histograms show the relative H3 acetylation enrichment during activation, obtained by dividing the value at 30 min and at 1 h of derepression by the value in repressing conditions (R value ~1). Error bars indicate the standard deviation of data obtained from biological replicates of samples analyzed in triplicate. *p<0.05; **p<0.001; ns, not significant. (B) Chromatin immunoprecipitation was performed as in (A) but on wild type and snf1 deletion strains.