
Figure 6. Normal spatial discrimination and normal rate remapping in DG-TeTX mice.
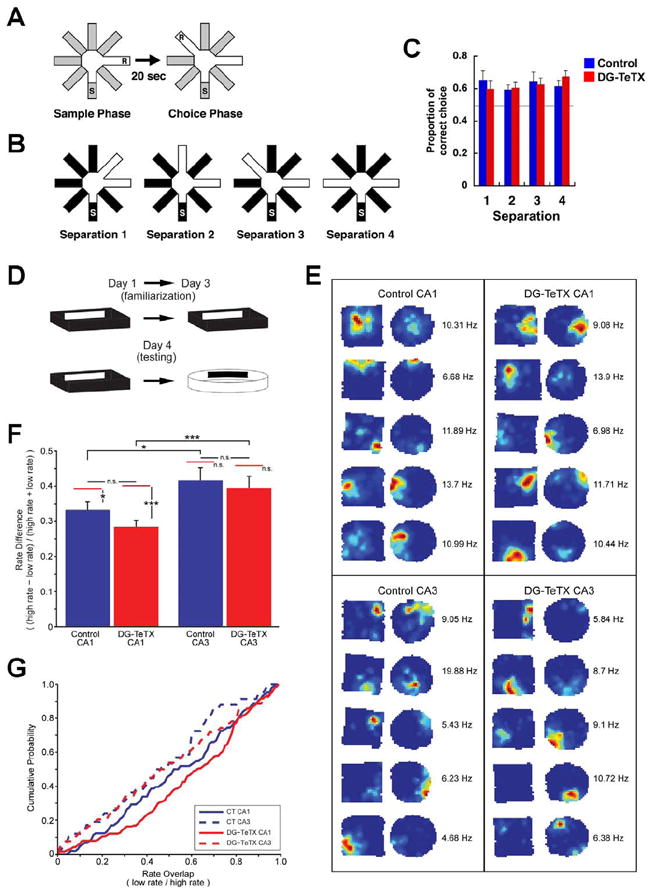
(A) Pattern separation was tested using a DNMP protocol by varying angles between sample and reward arms (S, start arm; R, reward; see Experimental Procedures). (B) Two arms were separated by 45°, 90°, 135° and 180° in separation 1-4, respectively. (C) Proportions of correct choices as a function of arm separation angles. The horizontal gray line represents chance. n=12 per genotype. (D) Example of behavioral pattern separation paradigm. (E) Place field examples from control (left) and DG-TeTX mice (right) for CA1 (top) and CA3 (bottom) pyramidal cells. The two maps from each example were normalized to the maximum peak firing rate between the maps, indicated to the right of each pair. (F) Rate remapping index for place cells recorded from CA1 (left) and CA3 (right) regions of control (blue) and DG-TeTX mice (red). There was a similar significant difference in rate between CA1 and CA3 in control and DG-TeTX mice (*p<0.05 and ***p<0.001, respectively, t-test). The red bars above each column represent the estimated rate difference (ERD) expected given independent firing in the two boxes for that region/genotype. Only significant differences were observed between the actual and ERD in the CA1 regions of control and DG-TeTX mice (*p=0.012 and ***p<0.001, respectively, t-test). (G) Cumulative probability histograms of the overlap values (low rate/high rate) for each genotype and region. Data represent mean ± SEM. See also Table S2.