Abstract
Assessment of treatment response in acute leukemia is routinely performed after therapy via bone marrow biopsy. We investigated the use of positron emission tomography (PET) for early assessment of treatment response in patients with acute myeloid leukemia (AML), using the proliferation marker 3′-deoxy-3′-[18F]fluoro-l-thymidine (FLT). Eight adult AML patients receiving induction chemotherapy underwent whole-body FLT PET/CT scans acquired at different time points during therapy. Patients who entered complete remission (CR) exhibited significantly lower FLT uptake in bone marrow than those patients with resistant disease (RD). In bone marrow, mean and maximum standardized uptake values were 0.8, 3.6 for CR and 1.6, 11.4 for RD, p < 0.001. FLT PET results for CR and RD patients were independent of assessment time point, suggesting that FLT PET scans acquired as early as 2 days after chemotherapy initiation may be predictive of clinical response. This pilot study suggests that FLT PET imaging during induction chemotherapy may serve as an early biomarker of treatment response in AML.
Keywords: Positron emission tomography (PET), Acute myeloid leukemia (AML), FLT, [18F]FLT, 3′-Deoxy-3′-fluorothymidine, Treatment response, Radionuclide imaging
1. Introduction
Assessment of treatment response in hematopoietic diseases is essential for disease management. One such disease is acute myeloid leukemia (AML), a proliferative malignancy of the hematopoietic system characterized by the interrupted or aberrant differentiation of myeloid progenitors [1]. Standard treatment of AML begins with induction chemotherapy that typically lasts one week. Approximately 7–10 days after completion of induction therapy, the efficacy of treatment is assessed via bone marrow aspirate and biopsy [2]. This early assessment is based upon data showing improved early outcomes for those patients with few leukemia cells at this time point [3].
Positron emission tomography (PET) is regularly used in the diagnosis and staging of cancer as it provides images of physiological function. The PET radiotracer 3′-deoxy-3′-[18F]fluoro-l-thymidine (FLT) has been used to validate the efficacy of chemotherapy in patients with lymphoma, breast cancer, and glioma [4-8]. A surrogate of cellular proliferation, FLT is a nucleoside analog that quickly accumulates in proliferating cells synthesizing DNA [9,10]. Bone marrow has a rapid proliferative rate and high FLT uptake in bone marrow has been demonstrated [11,12]. FLT PET imaging has been used to visualize and quantify increased cycling activity of hematopoietic cells in bone marrow to distinguish patients with different hematologic disorders [13]. Recently, Buck et al. demonstrated the feasibility of FLT PET for visualization of leukemia chloroma sites in AML patients [14]. We hypothesized that FLT PET could be useful in assessing early response to chemotherapy and conducted a pilot trial among eight AML patients receiving induction chemotherapy.
2. Materials and methods
2.1. Patients
In this pilot study, eight adult AML patients (six men, two women) ages 19–70 years were treated with induction chemotherapy with the intent of achieving a complete remission. All patients were administered cytarabine and idarubicin in the standard “7 + 3” regimen except for one patient who received cytarabine, idarubicin, fludarabine, and gemtuzumab ozogamicin (MY-FLAI). Bone marrow aspirate and biopsy were performed on all patients and the diagnosis was made using standard pathologic criteria [15,16]. Patient characteristics are described in Table 1.
Table 1.
Patient characteristics and treatment data.
| Patient number | Age | Sex | AML subtype | Cytogenetics | Treatment | Aplastic (day 14) | Reinduction | Complete remission (4–6 weeks) | Clinical response |
|---|---|---|---|---|---|---|---|---|---|
| 1 | 67 | M | M4 | 46 X, Y | Ida + Ara-C | Yes | No | Yes | CR |
| 2 | 47 | F | M2 | 46 X, X | Ida + Ara-C | Yes | No | No | RD |
| 3 | 55 | M | MLD | 46 X, Y | Ida + Ara-C | Yes | No | Yes | CR |
| 4 | 47 | M | M7 | Complex | Ida + Ara-C | No | Yes | Yes | CR |
| 5 | 20 | M | M1 | 46 X, Y | Ida + Ara-C | No | Yes | No | RD |
| 6 | 59 | M | MLD | 46 X, Y | Ida + Ara-C | Yes | No | Yes | CR |
| 7 | 70 | F | M4 | 46 X, X −7, + 21 | MY-FLAI | No | Noa | No | RD |
| 8 | 19 | M | MLD | 46 X, Y | Ida + Ara-C | No | Yes | Yes | CR |
MLD: multilineage dysplasia, Ida + Ara-C: idarubicin + cytarabine, MY-FLAI: fludarabine, idarubicin, cytarabine, gemtuzumab ozogamicin.
Patient 7 did not receive a second induction due to resistant disease (49% blasts in a hypercellular marrow) found on the day 14 bone marrow biopsy and other comorbidities.
2.2. Clinical response assessment
Initial response to chemotherapy was assessed via an early, post-induction therapy bone marrow biopsy on day 14 after the start of treatment [2]. Patients with residual leukemia were retreated with a second course of induction chemotherapy. Four to six weeks after induction chemotherapy, a follow-up bone marrow biopsy was performed to establish clinical response: those patients who entered complete remission (CR) and those with resistant disease (RD), as defined by Cheson et al. [2]. The only exception was patient 7 who exhibited no response to induction chemotherapy and received no further chemotherapy because of multiple comorbidities. Due to lack of response at day 14, patient 7 was considered to have resistant disease as indicated by the early bone marrow biopsy. Bone marrow biopsy data are in Table 2 and clinical response classifications are in Table 1.
Table 2.
Bone marrow biopsy/aspirate histological data.
| Patient number | Pre-treatment bone marrow
|
Day 14 bone marrow
|
4–6 weeks bone marrow
|
|||
|---|---|---|---|---|---|---|
| % Blasts | % Cellularity | % Blasts | % Cellularity | % Blasts | % Cellularity | |
| 1 | 45 | 80 | 3 | <5 | 3 | 40 |
| 2 | 58 | 95 | 0 | 10 | 100 | 90 |
| 3 | 23 | 100 | 0 | <5 | 2 | 60 |
| 4 | 23 | 55 | 5 | <5 | 3 | 30-40 |
| 5 | 85 | 95–100 | 32 | 50–60 | 44 | 80 |
| 6 | 16 | 90 | 4 | <5 | 1 | 80 |
| 7 | 27 | 80–90 | 49 | 60 | ND | ND |
| 8 | 20 | 100 | 4 | 50 | 1 | 50 |
ND: not determined.
2.3. FLT PET imaging
AML patients were injected intravenously with 5 mCi FLT and scanned using a GE Discovery LS PET/CT scanner. FLT was synthesized following the method described by Martin et al. with slight modifications [17]. All FLT samples were sterile, pyrogen free, with radiochemical purity >99%, and specific activity > 0.3 mCi/nmol. PET/CT imaging began 45 min post-injection and extended inferiorly from the top of the skull to the distal femora. Acquisition time was 10 min per bed position. PET images were reconstructed using the ordered subset expectation maximization (OSEM) reconstruction algorithm with 2 iterations, 28 subsets, and CT attenuation correction [18]. Scans were performed at progressively earlier time points of therapy (post-therapy, days 6, 5, 4, 2, and pre-therapy) in order to probe the earliest time at which treatment response could be reliably assessed. Two patients were scanned twice, before and after treatment. Five patients were scanned once, at different time points of therapy (Fig. 1). Day 1 was defined as up to 24 h from initiation of chemotherapy, day 2 was between 24 and 48 h, and so forth. In addition, 10 adult subjects without hematologic disease, but with other solid malignancies, received FLT PET/CT scans prior to their chemotherapy and these studies served as normal controls. Normal subjects were injected with 7 mCi FLT and imaged from the base of the skull to the distal femora, with all other scanning parameters identical to AML patients.
Fig. 1.

FLT PET imaging schedule. Blue arrows indicate when each patient was scanned. PET scans were acquired at progressively earlier time points of therapy. Bone marrow aspirate and biopsy were performed after therapy on day 14 (early) and between four and six weeks (follow-up). Patient 5 was not imaged due to development of epistaxis, unrelated to the PET scan.
The study protocol was approved by the University of Wisconsin (UW) Health Sciences Institutional Review Board, the Scientific Review Board of the UW Carbone Comprehensive Cancer Center, and the UW Radiation Drug Research Committee. Written informed consent for the FLT PET imaging procedure was obtained from each patient/subject prior to enrollment in the pilot study.
2.4. Image analysis
PET activity concentrations (MBq/cc) were converted to standardized uptake values (SUV) by dividing by the injected activity per patient mass. PET images of bone marrow were extracted from full PET images by first using the CT images to extract the bone. These CT bone volumes were expanded to include the marrow resulting in bone and marrow CT masks. These masks were applied to the PET images to isolate PET voxels representing bone and marrow. An SUV threshold of 0.5 (just above background) was applied to the masked PET images to extract marrow PET voxels, yielding PET images of bone marrow. The expected low FLT uptake in cortical bone but higher uptake in marrow facilitated this thresholding technique [14].
PET bone marrow images were used to characterize the bone marrow with the following assessment parameters: the mean SUV (SUVmean) and maximum SUV (SUVmax); a histogram of the bone marrow SUV distribution normalized by the number of bone marrow voxels; the heterogeneity or “spread” of the bone marrow SUV distribution as quantified by the coefficient of variation (CV), which is the standard deviation normalized by the mean. In addition, bone marrow of the pelvis, lumbar and thoracic vertebrae was contoured and these sub-regions were characterized using the same assessment parameters. Bone marrow parameters of CR and RD patients were compared to test the efficacy of the methodology for early assessment of treatment response. Assessment parameters were compared using Student’s t-test and differences were considered statistically significant at an alpha level less than 0.01.
3. Results
3.1. Bone marrow FLT uptake as a biomarker of clinical response
FLT PET/CT scans were well tolerated and no adverse events were noted, although one patient did not complete the scan due to development of epistaxis, unrelated to the PET scan. Of the seven patients who completed the scan, five patients were clinically classified as CR and two as RD. Maximum intensity projection FLT PET images of bone marrow of all AML patients grouped by clinical response are shown in Fig. 2. For each patient, SUVmean, SUVmax, and CV of the total body bone marrow are in Table 3.
Fig. 2.
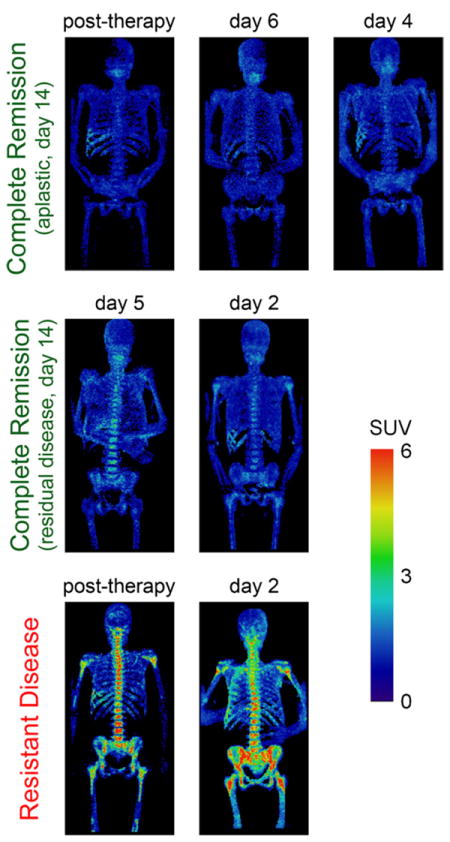
FLT PET images of bone marrow of seven AML patients, grouped by clinical response. PET scans were acquired at different time-points of therapy but results were consistent within each clinical response group (CR and RD), independent of time of assessment. RD exhibited elevated uptake (bottom row) while CR displayed low uptake (top and middle rows).
Table 3.
FLT PET treatment response assessment data.
| Patient number | Time of FLT PET scan | Total body bone marrow
|
||
|---|---|---|---|---|
| SUVmean | SUVmax | CV | ||
| 1 | Pre-treatment | 2.02 | 14.9 | 0.83 |
| Post-treatment | 0.71 | 3.8 | 0.29 | |
| 2 | Pre-treatment | 3.17 | 28.4 | 1.12 |
| Post-treatment | 1.46 | 12.3 | 0.75 | |
| 3 | Day 6 | 0.74 | 3.3 | 0.30 |
| 4 | Day 5 | 0.88 | 5.1 | 0.41 |
| 5 | No scana | NA | NA | NA |
| 6 | Day 4 | 0.84 | 3.6 | 0.30 |
| 7 | Day 2 | 1.74 | 10.6 | 0.66 |
| 8 | Day 2 | 0.85 | 3.0 | 0.33 |
NA: not applicable.
Patient 5 did not complete the FLT PET scan due to development of epistaxis, unrelated to the scan.
FLT PET response assessment results were consistent within each clinical response group (CR, RD). There did not appear to be a time dependent variation for those scans acquired during chemotherapy or shortly thereafter. CR patients exhibited low uptake almost completely in SUV < 2 range, suggesting successful bone marrow ablation. RD patients displayed elevated uptake especially in SUV > 2 range, likely signifying substantial remaining proliferative bone marrow disease and treatment failure. Both during and after therapy, SUVmean, SUVmax, and CV of CR patients were significantly lower than those of RD patients (Table 4). SUVmean of CR patients was half that of RD patients. SUVmax and CV of CR patients were less than half those of RD patients. Analysis of bone marrow of the pelvis, lumbar and thoracic vertebrae yielded results consistent with those of the total body bone marrow. For these sub-regions, SUVmean, SUVmax, and CV of CR patients were significantly lower than those of RD patients. Again, correlation between FLT PET response assessment and clinical response appeared independent of the time of assessment.
Table 4.
Statistical comparison of bone marrow FLT uptake for different clinical response groups.
| Clinical response group | SUVmean | t-test | SUVmax | t-test | CV | t-test |
|---|---|---|---|---|---|---|
| Complete remission (n = 5) | 0.81 ± 0.03 | p < 0.001 | 3.6 ± 0.4 | p < 0.001 | 0.33 ± 0.02 | p < 0.001 |
| Resistant disease (n = 2) | 1.60 ± 0.14 | 11.4 ± 0.8 | 0.71 ± 0.04 |
The five CR patients were further grouped using results from the day 14 early bone marrow biopsy. Three CR patients were aplastic (CRaplastic) and two exhibited residual disease (CRresidual) according to early biopsy (Tables 1 and 2). Both CRresidual patients received a second course of induction chemotherapy. When averaged over each response group, SUVmean, SUVmax, and CV were slightly higher in CRresidual patients than CRaplastic patients, but these differences were not statistically significant. FLT PET images of bone marrow of CRaplastic and CRresidual patients were similar, although there was visibly increased uptake in the vertebrae and pelvis of CRresidual patients that was not present in CRaplastic patients (Fig. 2). Bone marrow SUV distributions of CRaplastic and CRresidual patients were quite similar. For CRaplastic patients, 100% of the bone marrow signal exhibited SUV < 2 compared to 99% for CRresidual patients.
Patient 1 (CR) and patient 2 (RD) were scanned before and after therapy. FLT PET images of bone marrow and SUV distributions from their respective pre- and post-treatment scans are shown in Fig. 3. Pre-treatment, the RD patient showed significantly greater FLT uptake than the CR patient, especially in the upper SUV range. More than 11% of the RD patient’s bone marrow exhibited SUV > 8 compared with less than 1% of the CR patient’s bone marrow. Post-treatment, the CR patient’s bone marrow resided exclusively in the lower SUV range (100% bone marrow < SUV of 2), suggesting successful bone marrow ablation. The post-treatment scan of the RD patient revealed significant FLT uptake in SUV > 2 range (28% bone marrow > SUV of 2), indicating substantial remaining proliferative bone marrow. Note that the day 14 early bone marrow biopsies of both patients were aplastic.
Fig. 3.
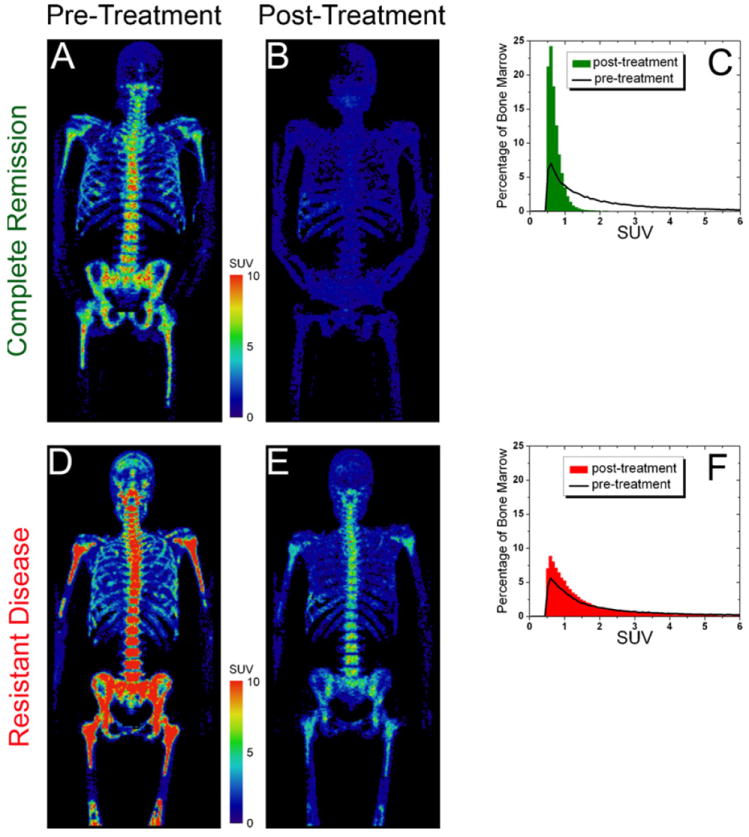
Comparison of CR and RD patients, pre- and post-treatment. Pre-treatment: FLT PET image of bone marrow of RD patient (D) exhibited markedly greater uptake than CR patient (A). Post-treatment: FLT PET images (B and E) and SUV distributions (C and F) revealed very low uptake for CR patient but substantial uptake for RD patient.
3.2. Heterogeneity of bone marrow in FLT PET response assessment
Both during and after therapy, bone marrow SUV distributions of RD patients were more heterogeneous (higher CV) than those of CR patients (Fig. 4). Bone marrow of RD patients displayed heterogeneous FLT uptake both in the lower and middle SUV ranges (24% bone marrow > SUV of 2) while bone marrow of CR patients exhibited almost exclusive uptake in the lower SUV range (99% bone marrow < SUV of 2). The heterogeneous SUV distribution of RD patients could be distinguished from the homogeneous SUV distribution of CR patients, but there was significant overlap of the two distributions in the lower SUV range.
Fig. 4.
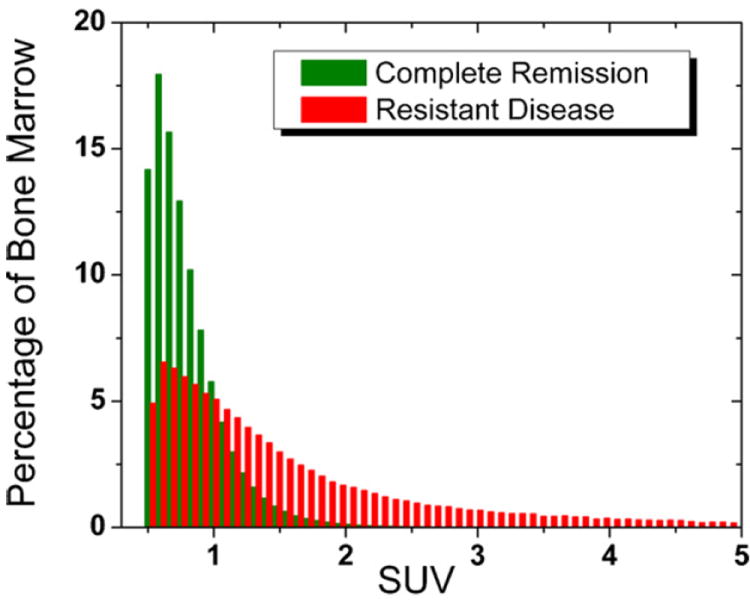
Overlay of bone marrow SUV distributions of CR and RD. Average SUV distributions (acquired during and after therapy) were determined for each clinical response group (CR and RD). The two distributions overlapped significantly in the lower SUV range. However, the heterogeneous RD distribution (red) with substantial uptake in SUV>2 range could be clearly distinguished from the more homogeneous CR distribution (green) with almost exclusive uptake in SUV<2 range.
The spatial heterogeneity of bone marrow response was further investigated by co-registering pre- and post-treatment FLT PET imaging data in the pelvic region for patient 2 (RD). Spatial heterogeneity of bone marrow FLT uptake is highlighted in Fig. 5. On a small spatial scale, there was substantial heterogeneity of bone marrow response, as response varied considerably throughout the pelvic region and in relation to other parts of the bone marrow.
Fig. 5.
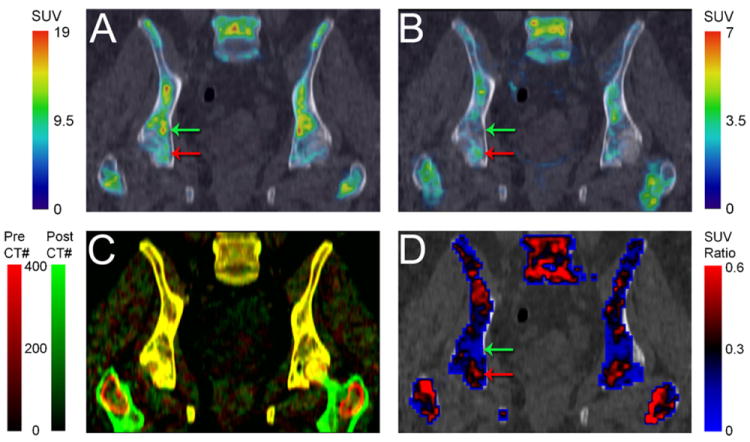
Heterogeneity of bone marrow response in AML patient with resistant disease. (A) Pre- and (B) post-treatment FLT PET/CT images of pelvic bone marrow. (C) Registration of pre- (red) and post-treatment (green) CT scans facilitated co-registration of corresponding FLT PET scans. Well registered regions are in yellow (red + green = yellow). (D) Ratio of post/pre-treatment bone marrow uptake demonstrates the heterogeneous response, with regions of good response (green arrows) and poor response (red arrows).
3.3. Comparison with normal controls
Bone marrow of the 10 normal controls was analyzed and assessment parameters were averaged over the 10 subjects. In normal controls, average SUVmean, SUVmax, and CV were 1.87 ± 0.05, 9.9 ± 0.7, 0.89 ± 0.02, respectively. On average, about 1% of bone marrow of normal controls exhibited SUV > 8 (%BMSUV> 8). An FLT PET image of bone marrow of a representative normal subject is shown in Fig. 6.
Fig. 6.
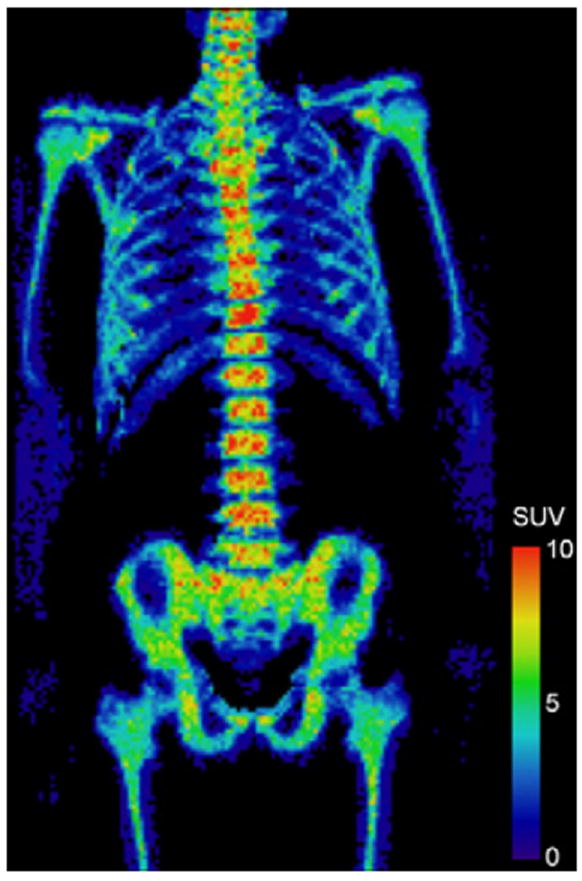
FLT PET image of bone marrow of a normal control subject.
Bone marrow of normal controls (Fig. 6) was compared with pre-treatment AML bone marrow (one CR patient and one RD patient, Fig. 3). Pre-treatment, SUVmean, SUVmax, CV, and %BMSUV> 8 determined for the CR patient (2.0, 14.9, 0.83, 1%) were quite similar to those of normal controls. However, the corresponding parameters for the RD patient (3.2, 28.4, 1.12, 11%) were considerably higher than those of normal controls, indicative of extremely over-proliferative bone marrow (Table 5).
Table 5.
Comparison of normal controls with AML patients pre-treatment.
| Subject/patient | SUVmean | SUVmax | CV | Percent of bone marrow with SUV greater than 8 |
|---|---|---|---|---|
| Normal controls (n = 10) | 1.87 | 9.9 | 0.89 | 1 |
| CR pre-treatment (n = 1) | 2.02 | 14.9 | 0.83 | 1 |
| RD pre-treatment (n = 1) | 3.17 | 28.4 | 1.12 | 11 |
The bone marrow SUV distribution of normal controls (averaged over 10 subjects) was very similar to that of the CR patient pre-treatment (Fig. 7). At all SUV, the ratio of the CR patient’s pre-treatment marrow to normal marrow uptake was approximately unity. In contrast, the RD patient’s pre-treatment bone marrow SUV distribution was quite different from that of the normal marrow, particularly in the higher SUV range. At SUV > 8, the RD patient’s pre-treatment marrow often displayed uptake over 100 times greater than that of normal marrow (Fig. 7). The areas under the SUV distributions (weighted by SUV) were 150, 160, 250 over all SUV and 10, 10, 100 over SUV > 8, for the normal marrow, CR and RD patients’ pre-treatment marrow respectively.
Fig. 7.
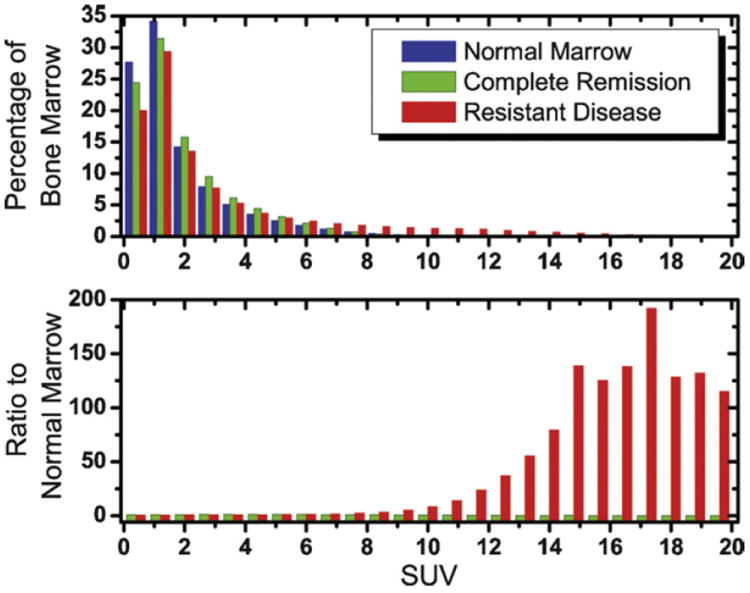
Comparison of bone marrow FLT uptake in normal subjects with that of AML patients pre-treatment. (Top) SUV distribution reveals similarity of normal marrow (blue) and marrow of CR patient pre-treatment (green), with almost all uptake in SUV<8 range. Distribution is quite different for RD patient (red) who displayed significant uptake in the SUV>8 range. (Bottom) At all SUV, the ratio of CR patient’s pre-treatment marrow to normal marrow uptake was approximately unity. At SUV > 8, RD patient’s pre-treatment marrow often displayed uptake over 100 times greater than that of normal marrow.
4. Discussion
Both during and after therapy, AML patients who entered complete remission displayed bone marrow with low FLT uptake in contrast to higher uptake in those patients with resistant disease. Successful induction chemotherapy results in complete ablation of the bone marrow which correlates with low FLT uptake in the bone marrow of CR patients. Poor treatment response is characterized by remaining proliferative bone marrow, which accounts for elevated uptake in RD patients.
Surprisingly, assessment of treatment response did not appear significantly affected by the time of assessment. FLT PET assessment parameters (SUVmean, SUVmax, and CV) were consistent within each clinical response group, independent of the time of assessment. Results were similar for CR patients scanned post-treatment, days 6, 5, 4, 2, as were results for RD patients scanned post-treatment and day 2. Thus, FLT PET imaging might be useful for treatment assessment very early during the course of induction therapy. This early assessment could significantly influence immediate decisions to continue or modify therapy as well as subsequent choices regarding post-remission therapy and possible bone marrow transplantation.
Interestingly, early treatment response assessment results obtained (as early as day 2) via FLT PET imaging correctly matched the clinical response (CR or RD on follow-up biopsy) in all seven imaged patients. However, the day 14 early bone marrow biopsy failed to correctly predict the clinical endpoint in one patient (patient 2, RD). This patient’s early biopsy was aplastic even though the post-treatment FLT PET scan clearly exhibited remaining proliferative bone marrow that failed to completely respond to induction therapy (Fig. 3). Ultimately, the follow-up biopsy revealed the presence of resistant disease in this patient. These results suggest that FLT PET imaging might have earlier and improved predictive power over bone marrow biopsy for treatment response assessment. However, this hypothesis should be confirmed in a larger clinical trial.
Results of the day 14 early bone marrow biopsy were used to further classify CR patients into CRaplastic (aplastic on day 14) and CRresidual (residual disease on day 14). Though not statistically significant, FLT uptake in the bone marrow of CRresidual patients was slightly higher than CRaplastic patients. Although differences were small, improved statistics collected from larger clinical trials could conceivably be used to successfully distinguish CRaplastic from CRresidual patients. This distinction could then be used to modify and tailor the therapy according to the specific nature of the treatment response.
Both during and after therapy, bone marrow SUV distributions of RD patients were more heterogeneous than those of CR patients. These heterogeneous distributions revealed the presence of both non-proliferating (ablated) and actively proliferating bone marrow at a macroscopic level corresponding to the spatial resolution of the PET scanner (~5 mm on the GE Discovery LS PET/CT scanner [19]). This heterogeneity in proliferation resulted in an overlap of the SUV distributions of RD and CR patients in the lower SUV range (Fig. 4), which may help explain the limited predictive power of the post-induction biopsy [20]. The biopsy is typically performed at the pelvis and as such, it is a single point measurement. Consequently, the biopsy might sample a region negative for residual disease despite the presence of residual disease in other parts of bone marrow that are not assayed. FLT PET imaging does not suffer from this drawback. Rather, FLT PET imaging enables three-dimensional visualization and quantitative assessment of the total body bone marrow volume as well as every sub-region within the spatial resolution limits of the PET scanner. This could be a significant advantage of FLT PET imaging over a single point biopsy for treatment response assessment.
Although only two AML patients (one CR, one RD) were imaged before therapy, a comparison of these patients’ pre-treatment scans with those of normal controls was quite revealing. Pre-treatment, bone marrow FLT uptake for the CR patient was quite similar to normal controls. However, uptake for the RD patient was considerably higher than normal controls, indicative of aggressive, over-proliferative bone marrow (Table 5 and Fig. 7). These results are consistent with Buck et al. who observed the highest FLT uptake in bone marrow of patients with refractory leukemia [14]. These findings suggest that treatment response might be predicted even before therapy using pre-treatment FLT PET data. Elevated, pre-treatment FLT uptake could be predictive of poor treatment response to standard chemotherapeutic regimens. In such cases, results of pre-treatment FLT PET scans could be used potentially to prescribe more aggressive dosing schemes in order to improve treatment outcomes. Clearly, larger clinical trials are necessary to establish the validity of this claim.
The promising results of this pilot study suggest the need for future trials. Initially, this pilot study should be expanded to include a larger number of AML patients imaged with FLT PET pre-treatment and at different time points during treatment. Imaging results should be correlated with analysis of the bone marrow biopsies (presence/absence of leukemic blasts, immunohistochemistry for Ki-67 proliferation marker, etc.) and with longer term outcome measures such as relapse-free and overall survival. Expansion of the trial to include multiple treatment response imaging time points should enable more accurate determination of the pharmacodynamic behavior and help identify the optimal imaging window for response prediction. Ideally, treatment response would be predicted early during therapy, or possibly even before therapy, thereby enabling treatment modification for improved clinical outcomes.
In summary, FLT PET imaging was used for early assessment of treatment response in AML patients undergoing induction chemotherapy. Treatment response was characterized and quantified by analysis of bone marrow FLT uptake, extracting SUVmean, SUVmax, the bone marrow SUV distribution and its heterogeneity. Using any of these assessment parameters, patients who entered complete remission could be distinguished from those with resistant disease, possibly as early as 2 days after the beginning of treatment.
This pilot study suggests FLT PET imaging during induction chemotherapy may serve as an early biomarker of treatment response in AML. As such, FLT PET imaging could influence clinical care by allowing earlier modification of induction therapy to achieve remission prior to moving forward with appropriate consolidation treatment. Given that a number of patients with a negative post-induction bone marrow biopsy fail to achieve a complete remission [20], FLTPET imaging may provide a more accurate tool for early assessment of treatment response in AML and deserves further study.
Acknowledgments
This work was supported by a grant from the UW Paul P.Carbone Comprehensive Cancer Center. We acknowledge Nancy Turman, the study coordinator, Chris Jaskowiak and Mark McNall, the PET technologists, and the UW Cyclotron Research Group for producing the FLT used in the study.
Footnotes
Contributions: M.V. performed research, analyzed data, and wrote the manuscript; M.J. designed the study, recruited and treated patients; S.P. supervised PET imaging; R.N. supervised radiotracer production; R.J. designed the study and supervised the research. All authors reviewed and approved the manuscript prior to submission.
Conflicts of interest statement
There are no conflicts of interest and no financial disclosures from any authors.
References
- 1.DeVita VT, Hellman S, Rosenberg SA. Cancer, principles & practice of oncology. Philadelphia, PA: Lippincott Williams & Wilkins; 2005. [Google Scholar]
- 2.Cheson BD, Bennett JM, Kopecky KJ, et al. Revised recommendations of the international working group for diagnosis, standardization of response criteria, treatment outcomes, and reporting standards for therapeutic trials in acute myeloid leukemia. J Clin Oncol. 2003;21:4642–9. doi: 10.1200/JCO.2003.04.036. [DOI] [PubMed] [Google Scholar]
- 3.Hiddemann W, Clarkson BD, Buchner T, et al. Bone marrow cell count per cubic millimeter bone marrow: a new parameter for quantitating therapy-induced cytoreduction in acute leukemia. Blood. 1982;59:216–25. [PubMed] [Google Scholar]
- 4.Buck AK, Kratochwil C, Glatting G, et al. Early assessment of therapy response in malignant lymphoma with the thymidine analogue [18F]FLT. Eur J Nucl Med Mol Imaging. 2007;34:1775–82. doi: 10.1007/s00259-007-0452-z. [DOI] [PubMed] [Google Scholar]
- 5.Pio BS, Park CK, Pietras R, et al. Usefulness of 3′-[F-18]fluoro-3′-deoxythymidine with positron emission tomography in predicting breast cancer response to therapy. Mol Imaging Biol. 2006;8:36–42. doi: 10.1007/s11307-005-0029-9. [DOI] [PubMed] [Google Scholar]
- 6.Kenny L, Coombes RC, Vigushin DM, et al. Imaging early changes in proliferation at 1 week post chemotherapy: a pilot study in breast cancer patients with 3′-deoxy-3′-[18F]fluorothymidine positron emission tomography. Eur J Nucl Med Mol Imaging. 2007;34:1339–47. doi: 10.1007/s00259-007-0379-4. [DOI] [PubMed] [Google Scholar]
- 7.Chen W, Delaloye S, Silverman DH, et al. Predicting treatment response of malignant gliomas to bevacizumab and irinotecan by imaging proliferation with [18F] fluorothymidine positron emission tomography: a pilot study. J Clin Oncol. 2007;25:4714–21. doi: 10.1200/JCO.2006.10.5825. [DOI] [PubMed] [Google Scholar]
- 8.Herrmann K, Wieder HA, Buck AK, et al. Early response assessment using 3′-deoxy-3′-[18F]fluorothymidine-positron emission tomography in high-grade non-Hodgkin’s lymphoma. Clin Cancer Res. 2007;13:3552–8. doi: 10.1158/1078-0432.CCR-06-3025. [DOI] [PubMed] [Google Scholar]
- 9.Shields AF, Grierson JR, Dohmen BM, et al. Imaging proliferation in vivo with [F-18]FLT and positron emission tomography. Nat Med. 1998;4:1334–6. doi: 10.1038/3337. [DOI] [PubMed] [Google Scholar]
- 10.Vesselle H, Grierson J, Muzi M, et al. In vivo validation of 3′deoxy-3′-[(18)F]fluorothymidine ([(18)F]FLT) as a proliferation imaging tracer in humans: correlation of [(18)F]FLT uptake by positron emission tomography with Ki-67 immunohistochemistry and flow cytometry in human lung tumors. Clin Cancer Res. 2002;8:3315–23. [PubMed] [Google Scholar]
- 11.Shields AF. PET imaging with 18F-FLT and thymidine analogs: promise and pitfalls. J Nucl Med. 2003;44:1432–4. [PubMed] [Google Scholar]
- 12.Shields AF, Grierson JR, Muzik O, et al. Kinetics of 3′-deoxy-3′-[F-18]fluorothymidine uptake and retention in dogs. Mol Imaging Biol. 2002;4:83–9. doi: 10.1016/s1095-0397(01)00070-x. [DOI] [PubMed] [Google Scholar]
- 13.Agool A, Schot BW, Jager PL, Vellenga E. 18F-FLT PET in hematologic disorders: a novel technique to analyze the bone marrow compartment. J Nucl Med. 2006;47:1592–8. [PubMed] [Google Scholar]
- 14.Buck AK, Bommer M, Juweid ME, et al. First demonstration of leukemia imaging with the proliferation marker 18F-fluorodeoxythymidine. J Nucl Med. 2008;49:1756–62. doi: 10.2967/jnumed.108.055335. [DOI] [PubMed] [Google Scholar]
- 15.Bennett JM, Catovsky D, Daniel MT, et al. Proposed revised criteria for the classification of acute myeloid leukemia. a report of the French-American-British cooperative group. Ann Intern Med. 1985;103:620–5. doi: 10.7326/0003-4819-103-4-620. [DOI] [PubMed] [Google Scholar]
- 16.Jaffe ES, Harris NL, Stein H, Vardiman JW. World health organization classification of tumors: pathology and genetics of tumors of haematopoietic and lymphoid tissues. Lyon, France: IARC Press; 2001. pp. 75–108. [Google Scholar]
- 17.Martin SJ, Eisenbarth JA, Wagner-Utermann U, et al. A new precursor for the radiosynthesis of [18F]FLT. Nucl Med Biol. 2002;29:263–73. doi: 10.1016/s0969-8051(01)00289-x. [DOI] [PubMed] [Google Scholar]
- 18.Hudson HM, Larkin RS. Accelerated image reconstruction using ordered subsets of projection data. IEEE Trans Med Imaging. 1994;13:601–9. doi: 10.1109/42.363108. [DOI] [PubMed] [Google Scholar]
- 19.Bolard G, Prior JO, Modolo L, et al. Performance comparison of two commercial BGO-based PET/CT scanners using NEMA NU 2-2001. Med Phys. 2007;34:2708–17. doi: 10.1118/1.2739808. [DOI] [PubMed] [Google Scholar]
- 20.Kern W, Haferlach T, Schoch C, et al. Early blast clearance by remission induction therapy is a major independent prognostic factor for both achievement of complete remission and long-term outcome in acute myeloid leukemia: data from the German AML cooperative group (AMLCG) 1992 Trial. Blood. 2003;101:64–70. doi: 10.1182/blood-2002-02-0532. [DOI] [PubMed] [Google Scholar]


