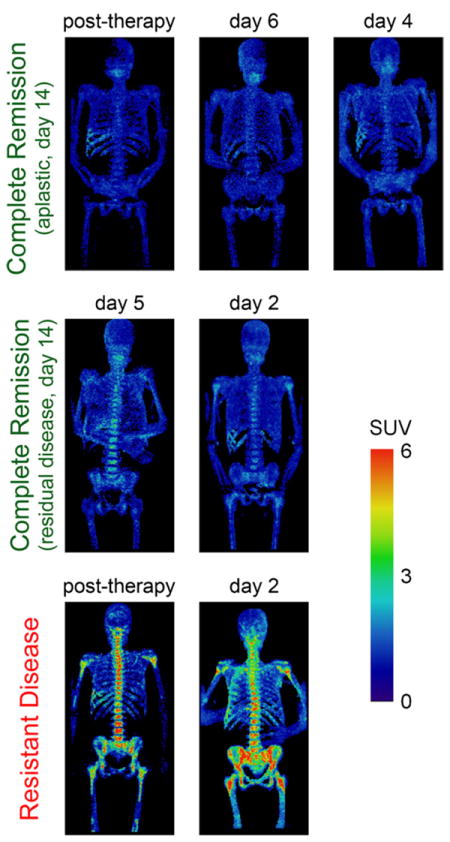
Fig. 2.

FLT PET images of bone marrow of seven AML patients, grouped by clinical response. PET scans were acquired at different time-points of therapy but results were consistent within each clinical response group (CR and RD), independent of time of assessment. RD exhibited elevated uptake (bottom row) while CR displayed low uptake (top and middle rows).
