
Fig. 5.
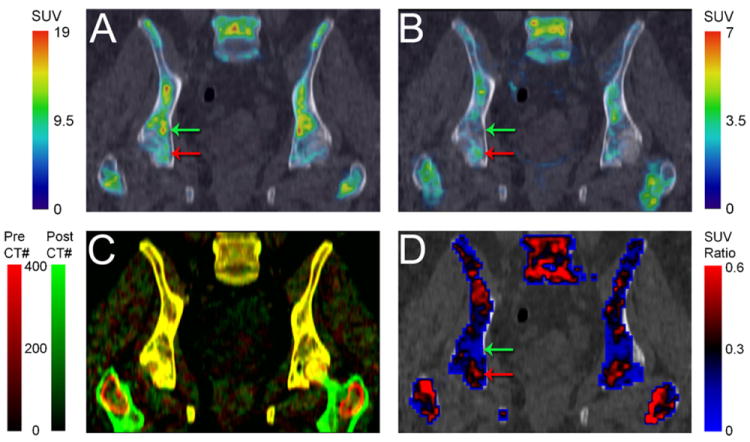
Heterogeneity of bone marrow response in AML patient with resistant disease. (A) Pre- and (B) post-treatment FLT PET/CT images of pelvic bone marrow. (C) Registration of pre- (red) and post-treatment (green) CT scans facilitated co-registration of corresponding FLT PET scans. Well registered regions are in yellow (red + green = yellow). (D) Ratio of post/pre-treatment bone marrow uptake demonstrates the heterogeneous response, with regions of good response (green arrows) and poor response (red arrows).