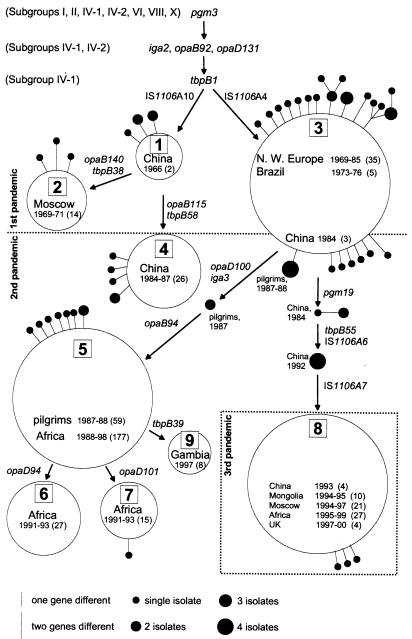
Figure 1.
Parsimonious relationships among 57 genotypes in nine genoclouds of subgroup III. Large boxed numbers from 1 to 9 indicate the genocloud designations. Alleles inherited from common ancestors with other serogroup A subgroups are shown at the top, and subsequent changes are shown next to the arrows that indicate lines of descent. Numbers in parentheses indicate numbers of isolates of the frequent genotypes, which are also reflected to a limited extent by the sizes of the circles. Rare genotypes were parsimoniously grouped in genoclouds after consideration of genetic relationships, sources, and dates of isolation. They are indicated by filled dots whose sizes indicate the numbers of isolates. The lengths of the lines connecting the dots to the genocloud circles indicate the numbers of genetic changes from the frequent genotype. Intermediate strains that were not assigned to genoclouds are shown along the arrows leading from genocloud 3.

