Figure 1.
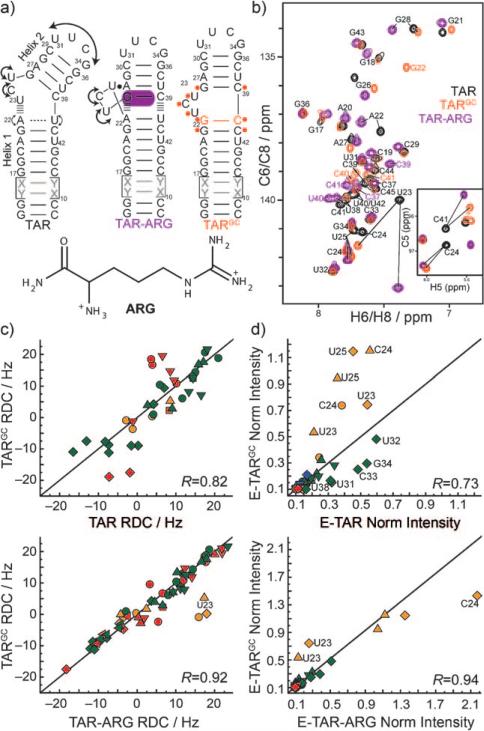
Biasing the TAR dynamic structure ensemble toward an ARG-bound state. a) Design of the TARGC sequence based on the structural dynamics of the TAR and TAR-ARG complexes. ‘X-Y’ base pairs denote alternating A-U/U-A or G-C/C-G base pairs used in the elongation.[8,9] Residues undergoing the largest chemical shift perturbations due to the G-C mutation are highlighted in orange on the TARGC secondary structure. b) Representative 2D CH HSQC spectra of TAR (black), TARGC (orange), and TAR-ARG (purple). Inset: 2D C,H HSQC C5-H5 spectra. c,d) Correlation plots. Red: residues in helix I, green: helix II, orange: in the bulge. R = correlation coefficients. ■ C2-H2, ▼ C8-H8, ▲ C6-H6, &25cf C5-H5, ◆ C1’-H1’, ◀ N1/3-H1/3. c) Correlation plots between RDCs measured in non-elongated TAR, TARGC, and TAR-ARG complexes. d) Correlation plots between normalized resonance intensities measured in EI-TAR, EI-TARGC, and EI-TAR-ARG.

