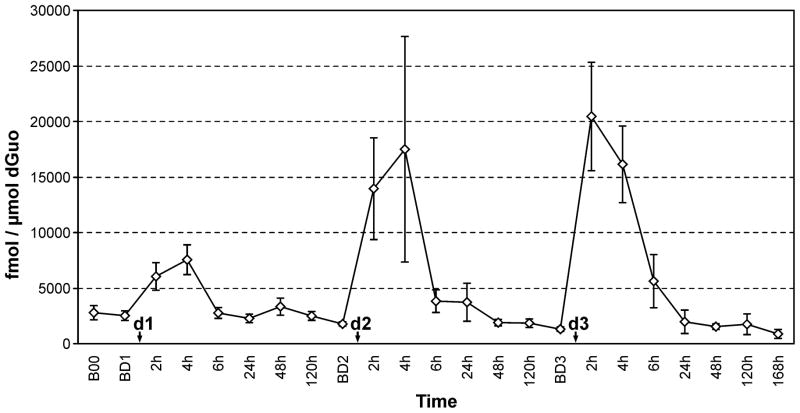
Figure 1. Summary of the mean levels of N2-ethyl-dGuo at various intervals before and after the three doses.
The graph summarizes the mean levels of N2-ethyl-dGuo (fmol/μmol dGuo) measured in the oral cell DNA of the 10 subjects at the time-points analyzed in the study. The first time-point reported on the left (B00) refers to the orientation meeting, 1 week before consumption of the first dose. This time-point represents the point at which participants began to abstain from consuming any alcoholic beverage other than the dose administered for the study. The next time-point (BD1) refers to the baseline level detected 1 week later, 1 h before consumption of the first dose (d1, lowest). Subsequently, the graph shows the levels of N2-ethyl-dGuo measured at the various time-points considered after each dose (2h – 120h). The DNA adduct levels were measured at the same time-points before and after exposure to the next 2 doses (d2, intermediate, and d3, highest). The baseline time points measured 1h before the dose (BD1, BD2 and BD3) are seven days apart. Values are means and standard errors.

