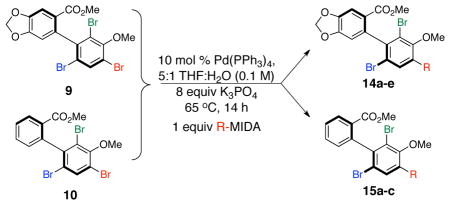
Table 2.
Regioselective cross-couplings of tribrominated biaryls.
 | |||||
|---|---|---|---|---|---|
| entry | product R= | substrate | % yielda (% rec. SM) | regioselectivityb,c,d (A:B:C) | SM er Pdt ere,f |
| 1 |
 14a |
9 | 70 (20) | 11.0:1.0:1.0 | 95.0:5.0 |
| 97.0:3.0 | |||||
| 2 |
 14b |
9 | 48 (20) | 17.0:1.0:1.0 | 95.0:5.0 |
| 98.0:2.0 | |||||
| 3 |
 14c |
9 | 55 (20) | >30.0:1.0:1.0 | 95.0:5.0 |
| 97.5:2.5 | |||||
| 4 |
 14d |
9 | 52 (23) | 24.0:2.0:1.0 | 95.0:5.0 |
| 94.5:4.5 | |||||
| 5 |
 14e |
9 | 49 | 5.0:1.0:1.0 | 95.0:5.0 |
| 95.0:5.0 | |||||
| 6 |
 15a |
10 | 45 (19) | 10.0:1.0:1.0 | 95.0:5.0 |
| 97.0:3.0 | |||||
| 7 |
 15b |
10 | 45 (30) | 10.0:1.0:-- | 95.0:5.0 |
| 95.5:4.5 | |||||
| 8 |
 15c |
10 | 52 (23) | 14.0:1.0:1.0 | 95.0:5.0 |
| 96.0:4.0 | |||||
Average isolated yields of three experimental runs.
Assigned by NMR analysis.
Ratio determined by 1H NMR.
Averaged over three experimental runs.
Enantiomer ratios were determined by HPLC analysis.
Averaged over three runs.
