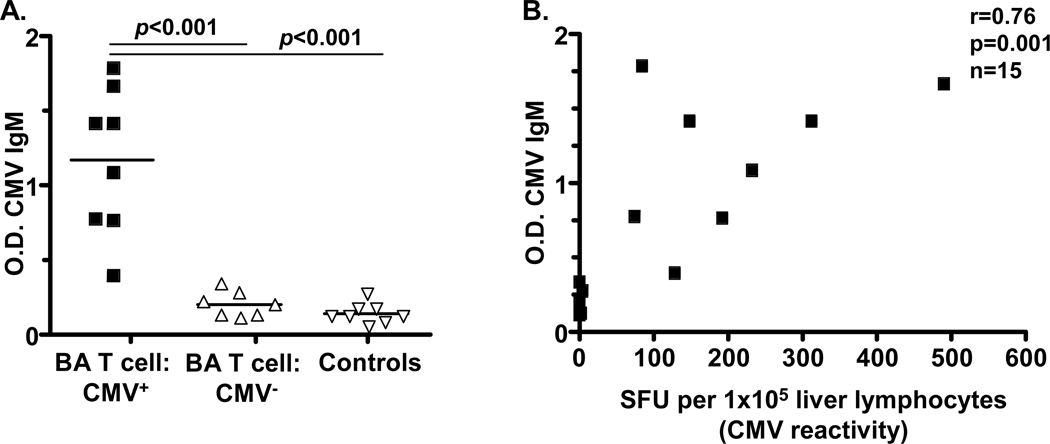
Figure 4. Detection of plasma CMV-IgM and correlation with liver T cell response.
A. Plasma CMV-IgM levels: Each symbol reflects the average O.D. reading from duplicate wells per patient sample. The solid line is the average of all patient samples within the group. Groups include BA patients with CMV-specific liver T cell responses (BA T cell: CMV+), BA patients without CMV-specific liver T cell responses (BA T cell: CMV−), and control patients. B. Positive Pearson correlation between BA plasma CMV-IgM level and CMV-specific liver T cell response.

