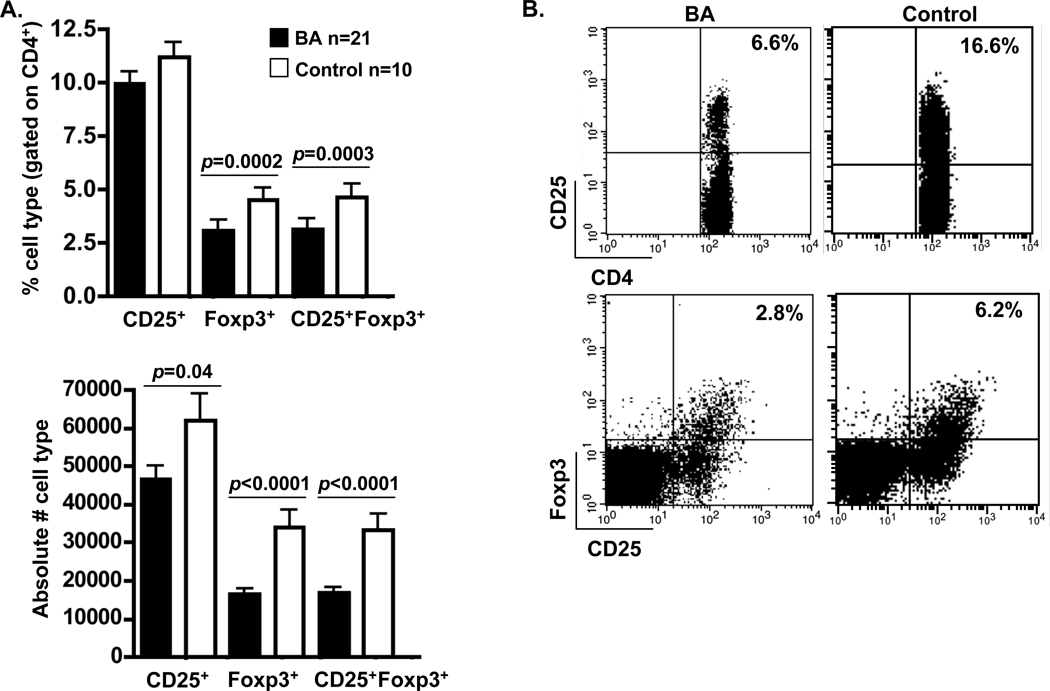
Figure 5. Quantification of peripheral blood regulatory T cells (Tregs).
Purified peripheral blood T cells were incubated with antibodies to CD4, CD25 and FoxP3 and quantified by FACS analysis. A. FACS analysis of percent and absolute number of T cell populations (mean±SEM), gated on forward/side scatter density plot lymphocyte population and CD4+ histogram. B. Representative density plot of Treg populations.

