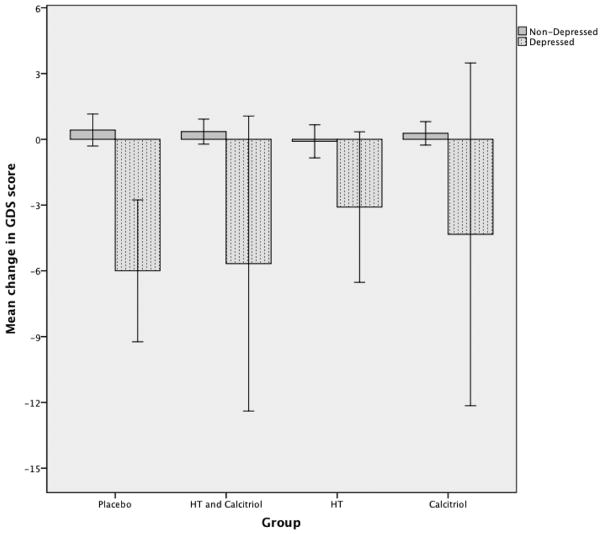
Fig. 1.
Comparison of mean change in GDS scores in depressed and non-depressed people.
Error bars represent 95% C.I.
HT-Hormone Therapy with conjugated equine estrogens 0.625 mg/daily in hysterectomized women or combined with medroxyprogesterone acetate 2.5 mg/daily in women with intact uterus. Calcitriol - 0.25g twice daily.
Y-axis represents mean of difference between final GDS and baseline GDS.

