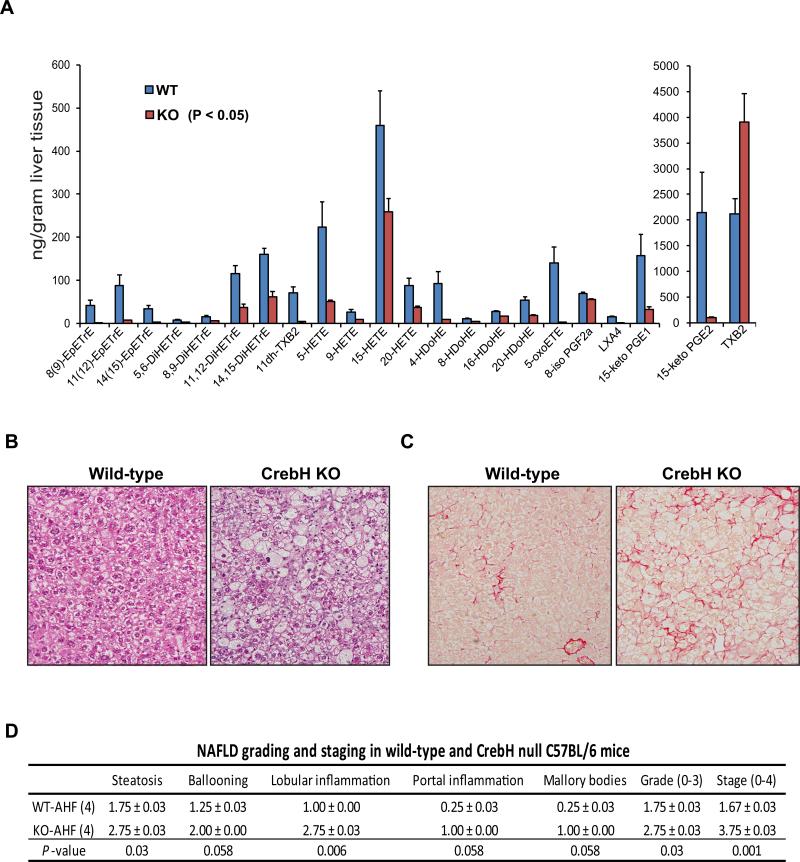
Figure 4. Deletion of CrebH leads to impaired FA metabolism and profound NASH in the mice under the AHF diet.
(A) Lipidomic analysis of eicosanoids and docosanoids in the liver tissues of the CrebH null and wild-type control mice after the AHF diet for 6 months. Levels of lipid metabolites that were decreased or increased in the CrebH null liver, compared to that in the wild-type control liver (P-value cutoff was <0.05), were shown. Each bar denotes the mean ± SEM (n=4 mice per group). (B) Histological examination (hematoxylin eosion staining) of liver tissue sections of the CrebH null and wild-type mice after the AHF diet for 6 months (magnification: 200x). (C) Sirius staining of collagen deposition in the liver tissue of the wild-type and CrebH null mice after the AHF diet (magnification: 200x). (D) Histological scoring for NASH activities in the livers of the CrebH null and wild-type mice after the AHF diet for 6 months. The Grade scores were calculated based on the scores of steatosis, hepatocyte ballooning, lobular and portal inflammation, and Mallory bodies. The Stage scores were based on the liver fibrosis. Mean ± SEM (n=4) values are shown. P-values were calculated by Mann-Whitney U-test.

