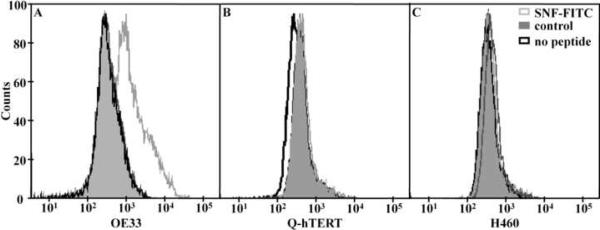
Fig. 4.
FACS analysis. A) The mean value for the fluorescence-labeled SNFYMPL peptide (gray line) binding to OE33 cells on FACS is 2613 compared to 441 and 462 for the control peptide (shaded) and cells only (black line). Minimal differences were observed in the mean value for peptide binding to the control cells B) Q-hTERT and C) H460.

