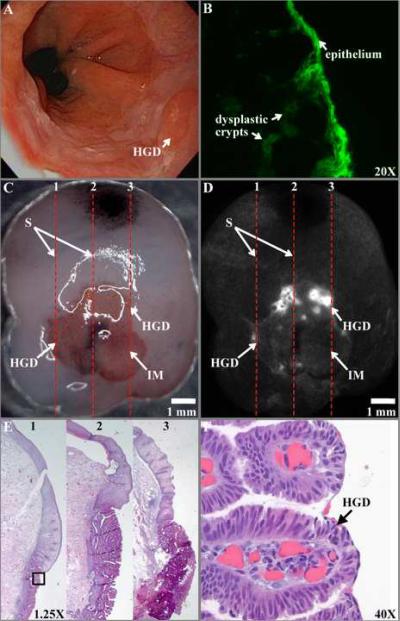
Fig. 6.
Dysplasia in Barrett's esophagus. A) On white light endoscopy, a flat foci of HGD is present. B) A fluorescence photomicrograph shows the FITC-labeled peptide binding to dysplastic epithelium to sub-surface crypts, magnification 20×.C) On stereomicroscopy, squamous (S) epithelium and intestinal metaplasia (IM) can be identified by a pink and red color, respectively, but not HGD, scale bar 1 mm. The dashed lines (1–3) spaced 2 mm apart identify the length of sections to be cut for histology. D) Increased intensity can be seen from FITC-labeled peptide bound to foci of HGD on the fluorescence image. E) Histology cut along sections (1–3) is evaluated in 1 mm intervals, magnification 1.25×. F) HGD (expanded view of black box in 6E) is identified histologically by large, non-uniform nuclei with extensive stratification and lack of cytoplasmic mucin, magnification 40×.

