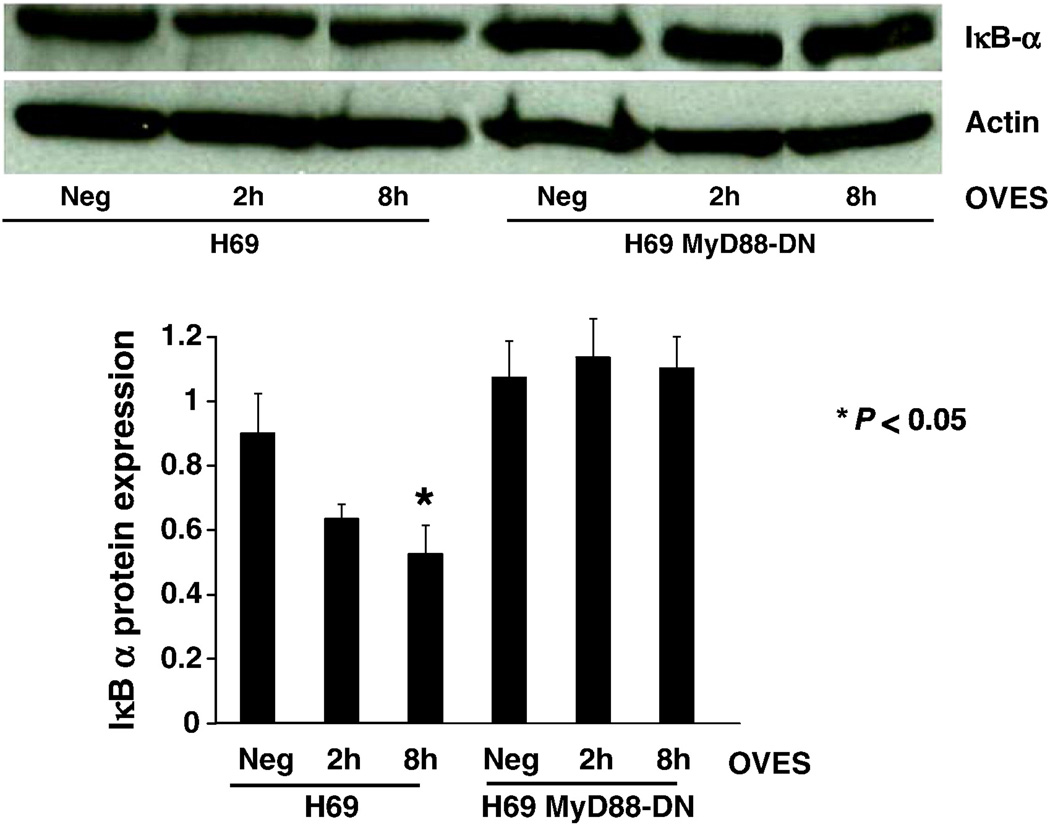
Fig. 2.
Western blot analysis of IκB-α in control (neg), O. viverrini ES cocultured for 2 h and 8 h in H69 cells (H69) or H69-MyD88 dominant negative (H69-MyD88-DN). Densitometric analysis normalized to actin is shown in the lower panel. Significant (P < 0.05) degradation of IκB-α, compared to control, is shown at 8 h following incubation with the OVES. Each value represents the mean ± SE of three independent experiments.

