Figure 2.
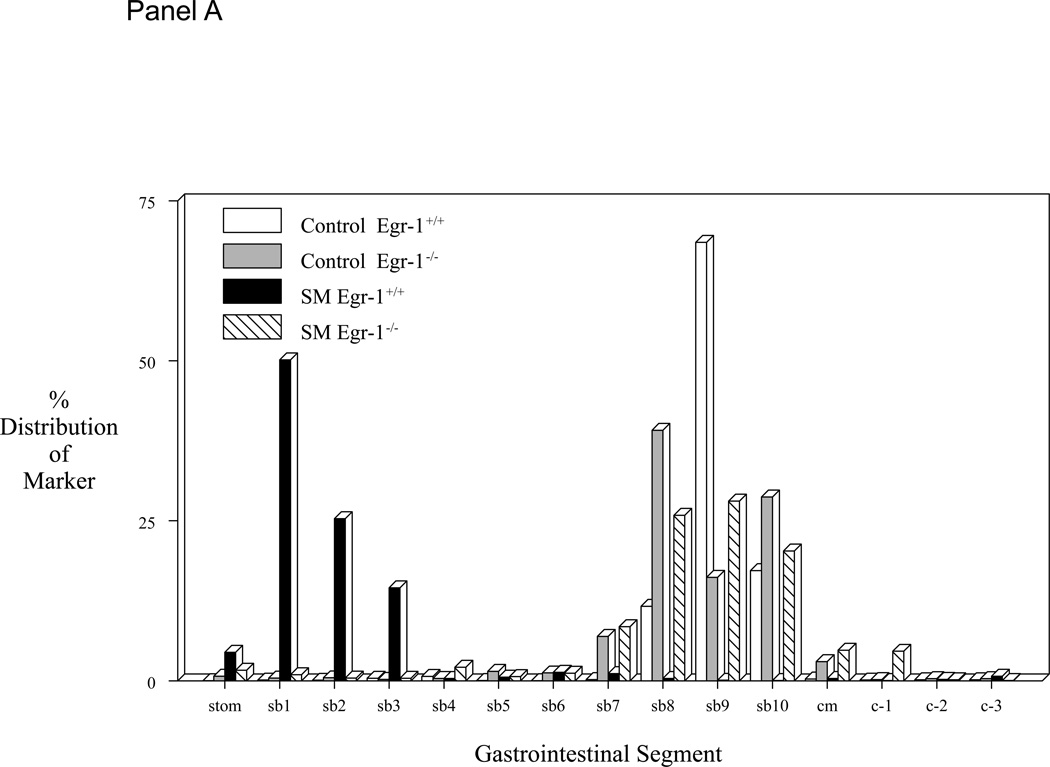
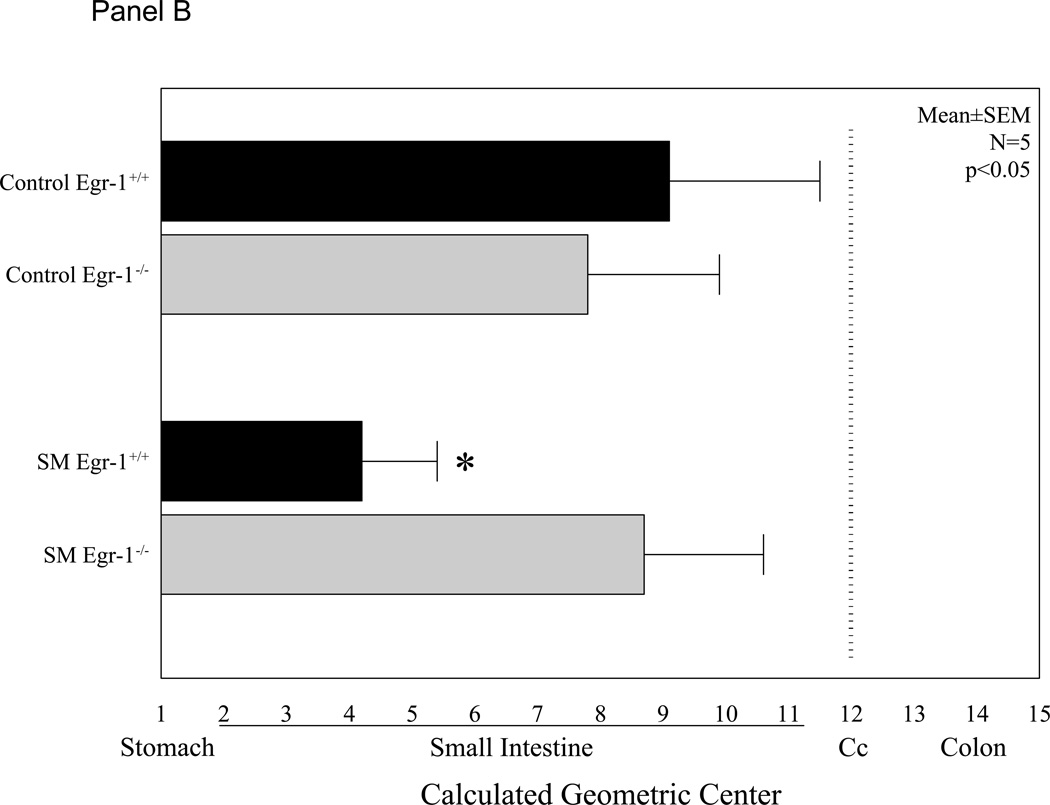
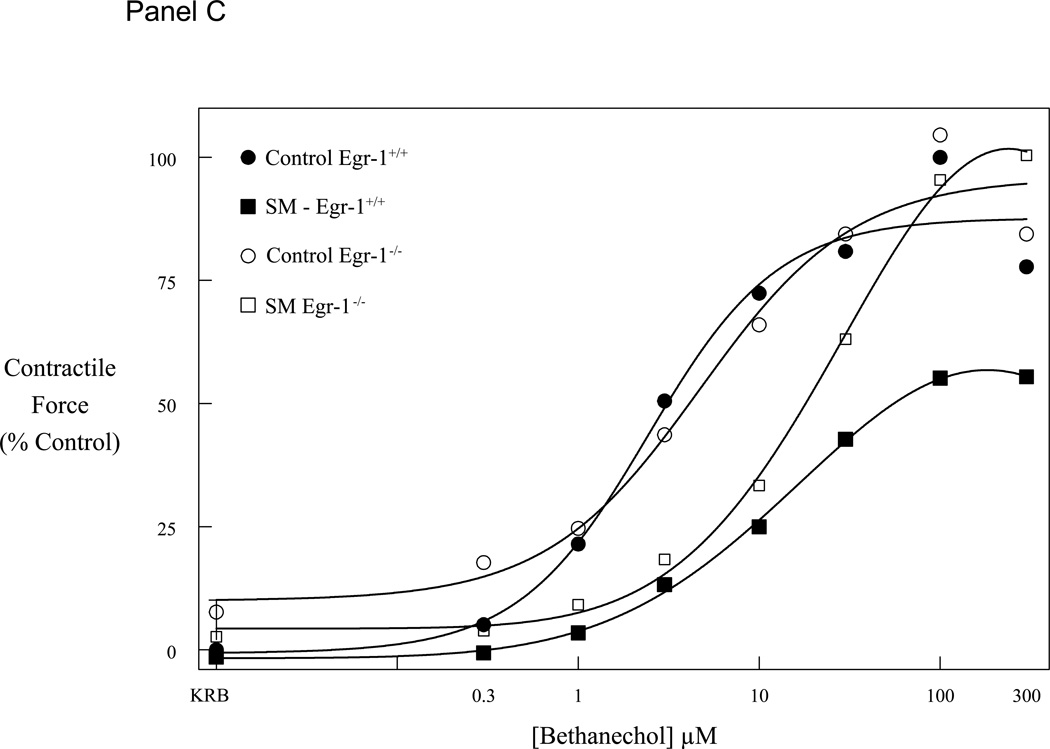
Panel A plots the averaged gastrointestinal transit distribution histograms using FITC-dextran measured in control Egr-1+/+ and Egr-1−/− mice (open and gray bars). Twenty-four hours after surgical manipulation (SM) a delay was observed in the gastrointestinal transit of Egr-+/+ mice (solid bars), but not in Egr-1−/− mice (cross-hatched bars) (st=stomach, sb=small bowel, cm=cecum, c=colon). Panel B: Calculated geometric centers from the transit distribution histograms for the four groups of mice. Panel C: Graph of bethanechol-stimulated dose-response curves for jejunal circular muscle strips obtained from control and manipulated, Egr-1+/+ and Egr-1−/− mice. Control dose-response curves to increasing concentrations of bethanechol were similar between Egr-1+/+ (● closed circles) and Egr-1−/− (○ open circles) mice. Twenty-four hours after surgical manipulation muscle strip contractions were diminished in Egr-1+/+ (■ closed square), but not in Egr-1−/− (□ open squares) mice. Data are expressed as mean ± SEM (N=5).


