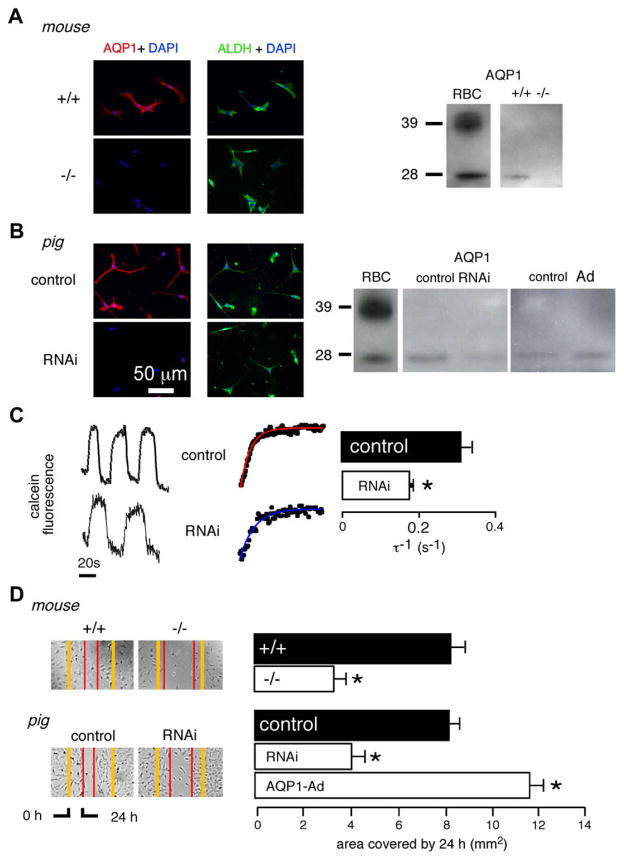
Fig. 2.
Cell migration in keratocyte cultures. (A) (Left) AQP1 (red) and ALDH (green) immunofluorescence in keratocyte cultures from wildtype mice (+/+) and AQP1 knockout (−/−) mice. Nuclei stained blue with DAPI. (Right) AQP1 immunoblot analysis. (B) (Left) AQP1 (red) and ALDH (green) immunofluorescence in control and AQP1-RNAi-treated keratocyte cultures from pig. (Right) AQP1 immunoblot analysis. Mouse and pig blood cell (RBC) membranes used as positive controls. (C) Osmotic water permeability. (Left) Representative calcein fluorescence recordings in response to hypoosmolar challenge. Expanded view with exponential fits shown in middle panel. Perfusate switch from PBS to PBS:water (1:1) results in osmotic cell swelling and increased calcein fluorescence. (Right) Reciprocal exponential time constants for osmotic equilibration (τ−1) from control and AQP1-RNAi-treated pig keratocyte cultures (SE, n = 4, *p < 0.01). (D) In vitro wound healing assay. (Left) Phase contrast micrographs of wounded cell monolayers showing wound closure at 24 h in mouse and pig keratocyte cell cultures. (Right) Summary of wound closure data (SE, n = 4, *p < 0.01). (For interpretation of the references to colour in this figure legend, the reader is referred to the web version of this article.)

