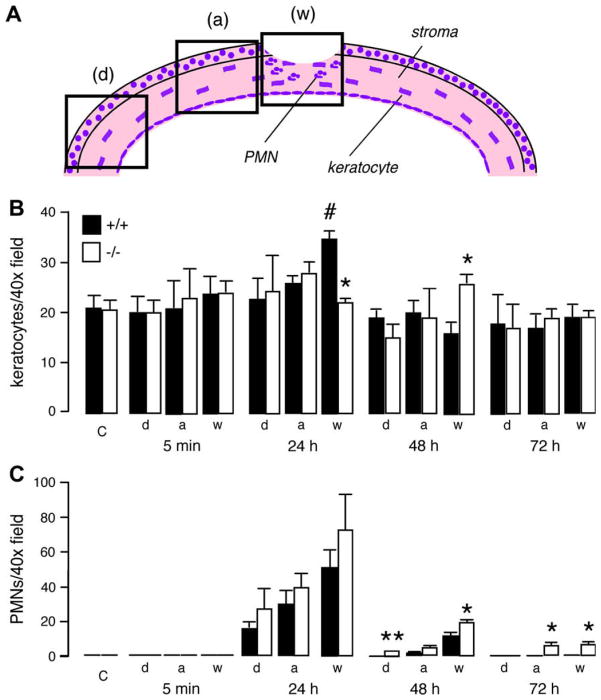
Fig. 4.
Quantification of corneal wound healing. (A) Diagram showing areas of mouse corneas analyzed. (B) Number of keratocytes per 40× (total magnification 400×) field, and (C) number of neutrophils per 40× field (SE, n = 5, *: compared to wildtype, p < 0.05; #: compared to control non-injured corneas, p < 0.01); a: adjacent region; d: distal region; w: wounded region; C: non-wounded cornea.

