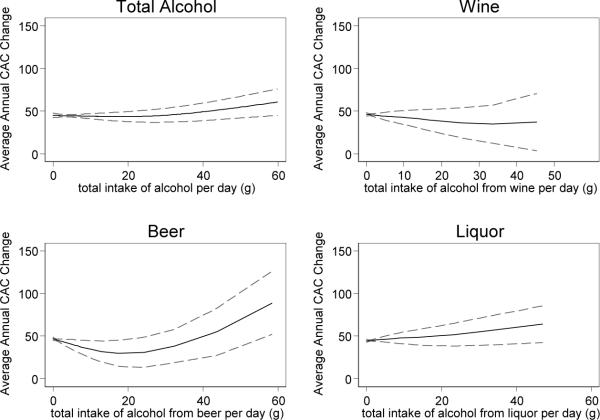
Figure 2.
Smoothed Plot of Alcohol Consumption versus Annualized CAC Progression with 95% Confidence Bands
For each alcohol type the estimated grams of alcohol consumed per day is shown based on the food frequency questionnaire data. Average annual CAC change is the change in CAC score between baseline and follow-up, divided by the time between scans in years. The plot includes only those with CAC>0 at baseline, and excludes former drinkers. A generalized additive model was used, adjusting for age, gender, race/ethnicity, smoking, income, and education. The dotted lines indicate the 95% confidence bands.

