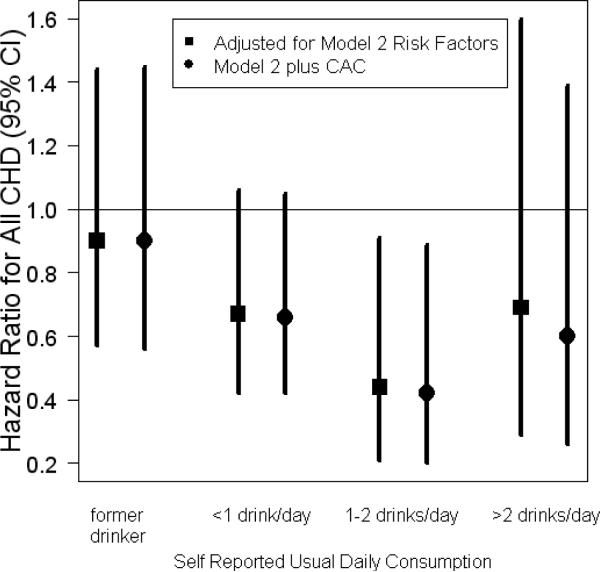
Figure 3.
Usual alcohol consumption and risk of CHD with and without adjustment for CAC Points indicate the hazards ratios relative to never drinkers for each category of self-reported usual daily consumption, and lines indicate the corresponding 95% confidence intervals. Square points adjust for age, gender, race, smoking, education, income, body mass index, systolic and diastolic blood pressure, use of anti-hypertensive medications, diabetes, HDL cholesterol, CRP, and fibrinogen. Round points adjust for those factors and coronary artery calcium.

