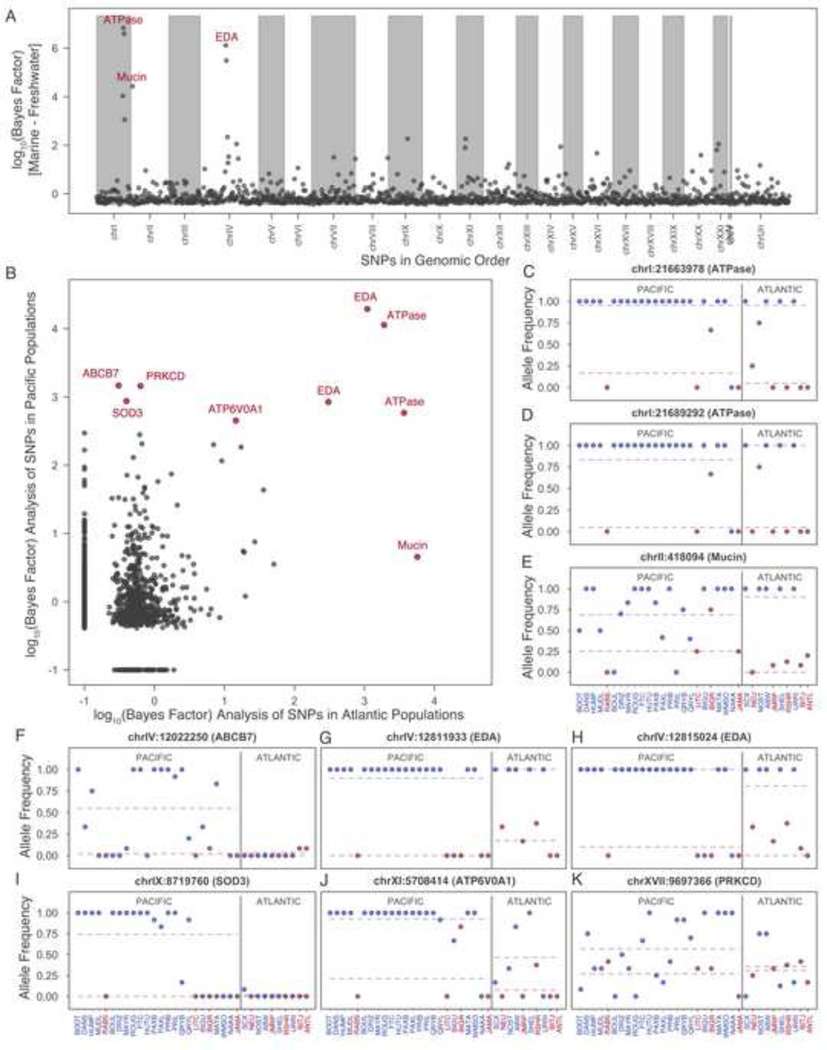
Figure 2. Bayesian scan for genomic regions consistently differentiated between marine and freshwater environments.
(A) Bayes factor scores for all markers in the genome, with the top scoring regions (ATPase, EDA, and Mucin gene cluster regions on chromosomes I, II, and IV, respectively) indicated in red. (All SNPs with log10 Bayes factors >=1.5 are listed in Table S3) (B) Bayes factors scores found when Pacific and Atlantic Ocean sticklebacks are analyzed as separate regional groups. SNPs with Bayes factors >2.5 in either population are labeled with corresponding gene region in red. (C–K) Allele frequencies in each of the 34 global populations for top ranking SNPs highlighted in panels A and B (freshwater populations: blue points; marine populations: red points; mean freshwater and marine allele frequency: blue and red dashed lines, respectively; Pacific and Atlantic populations grouped on the left and right side of the vertical solid grey line).

