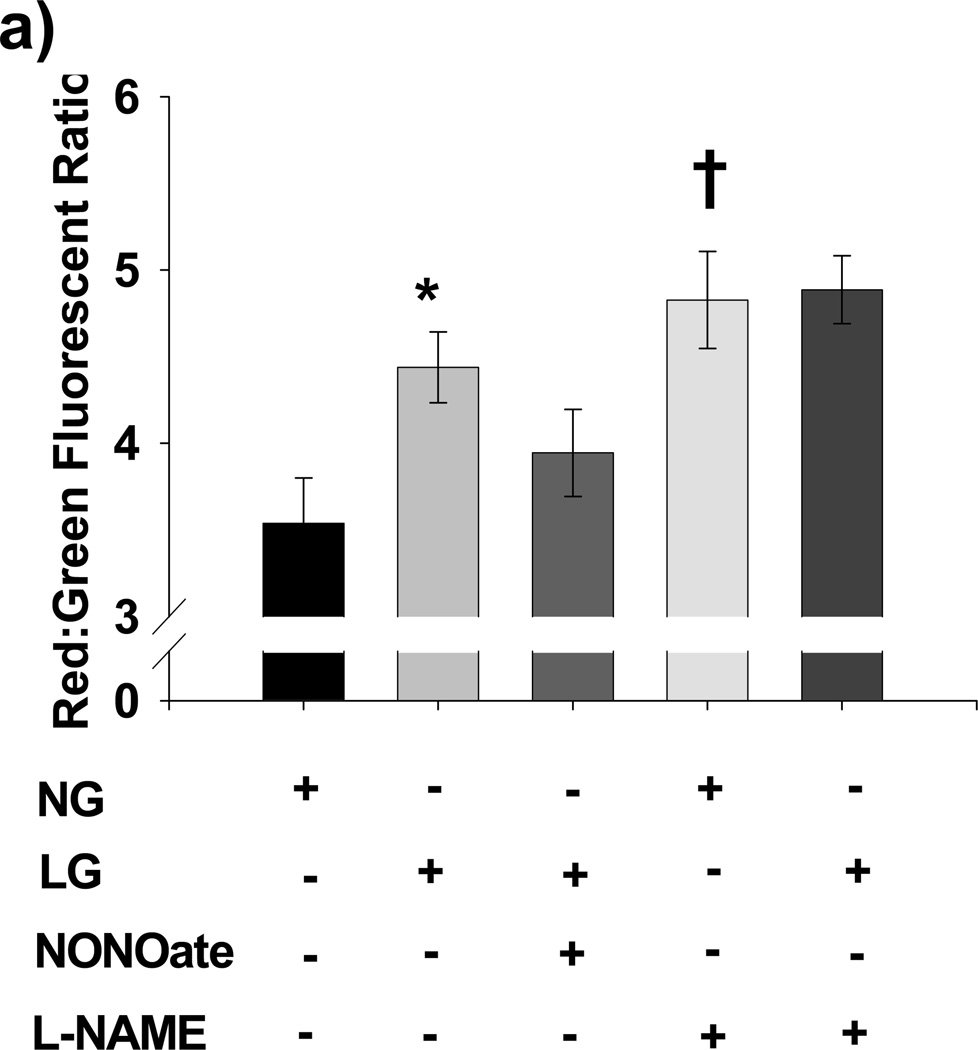
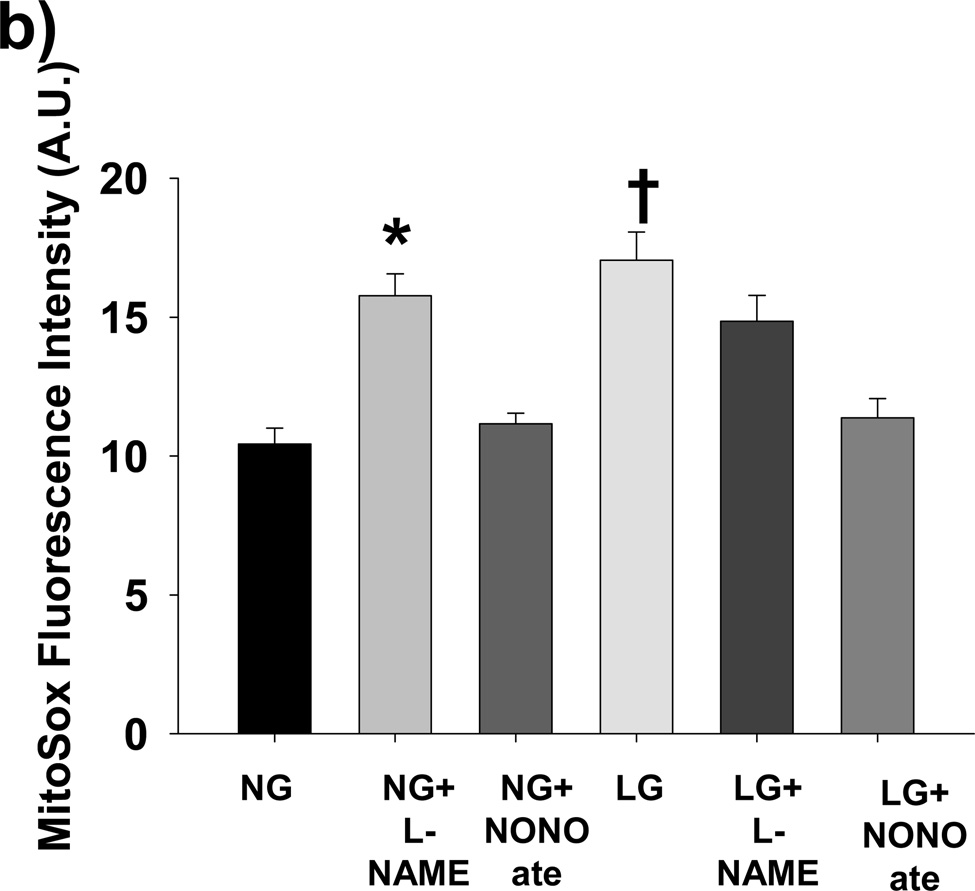
Figure 2. Role of NO in LG-induced Mitochondrial Hyperpolarization and Mitochondrial ROS production.
(a) LG induced significant mitochondrial membrane hyperpolarization as reflected by an increased red: green fluorescent intensity ratio from JC-1 relative to NG. Further, exposure to exogenous NO (Spermine NONOate, 10 µM) reversed LG-induced hyperpolarization, while inhibition of eNOS with L-NAME (1 mM) induced hyperpolarization under NG conditions. (N=6–22 for each exposure. *P<0.001 overall and vs. NG, P=0.007 vs. LG+NONOate. †P=0.004 for NG vs. NG+LNAME). (b) L-NAME increases mitochondrial ROS production under NG (90 mg/dL D-glucose) to the level seen under LG conditions (40 mg/dL D-glucose + 50 mg/dL L-glucose). Spermine NONOate exposure prevented LG induced increases in mitochondrial ROS production. No increased in mitochondrial ROS production was seen with the addition of L-NAME under LG conditions (P<0.001 overall, *-P <0.005 for NG+L-NAME vs. NG and LG+NONOate, †- P<0.008 for LG vs. NG, NG+NONOate, and LG+NONOate).


