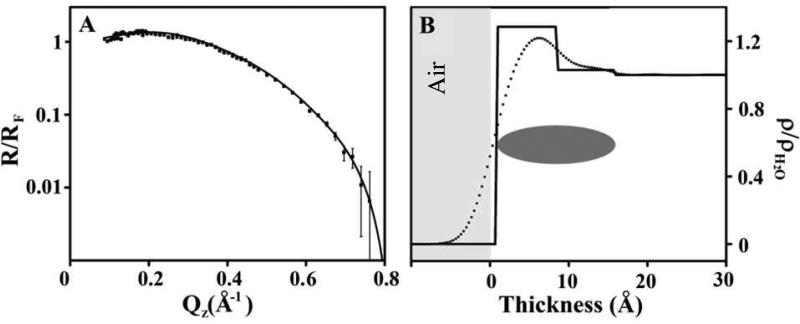
Figure 3.
(A) Fresnel normalized X-ray reflectivity (R/RF) and (B) water normalized electron density (ρ/ρH2O) of hTau40 adsorption to the air/water interface at 23 °C and 1 μM. The dashed line indicates a model independent fit and the solid line indicates a box-model fit. A schematic indicating the location of the hTau40 is also included. Thickness value 0 corresponds to air/protein interface where negative values indicate the air phase.

