
Figure 2.
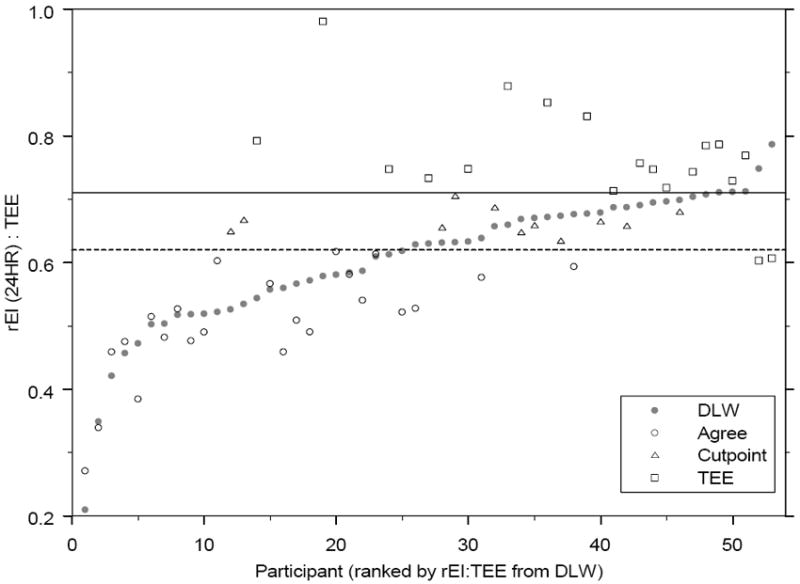
Men: Ratio of reported energy intake (rEI) on the average of two 24-hour recalls to total energy expenditure (TEE), as estimated by doubly labeled water (DLW, illustrated with filled circles) or the Goldberg method (circles, triangles, and squares) by participant, ranked by ratio from DLW value. Only the participants classified as underreporters by either method (24HR: n = 53 are shown in the figure. Open circles indicate that the Goldberg method classification agrees with DLW classification; triangles indicate that the difference between the two methods is due to differences in the cutpoints; and squares indicate that the differences are due to estimation of TEE. The dashed line represents the cutpoint from the Goldberg method (0.62), and the solid line represents the cutpoint from DLW (0.71).