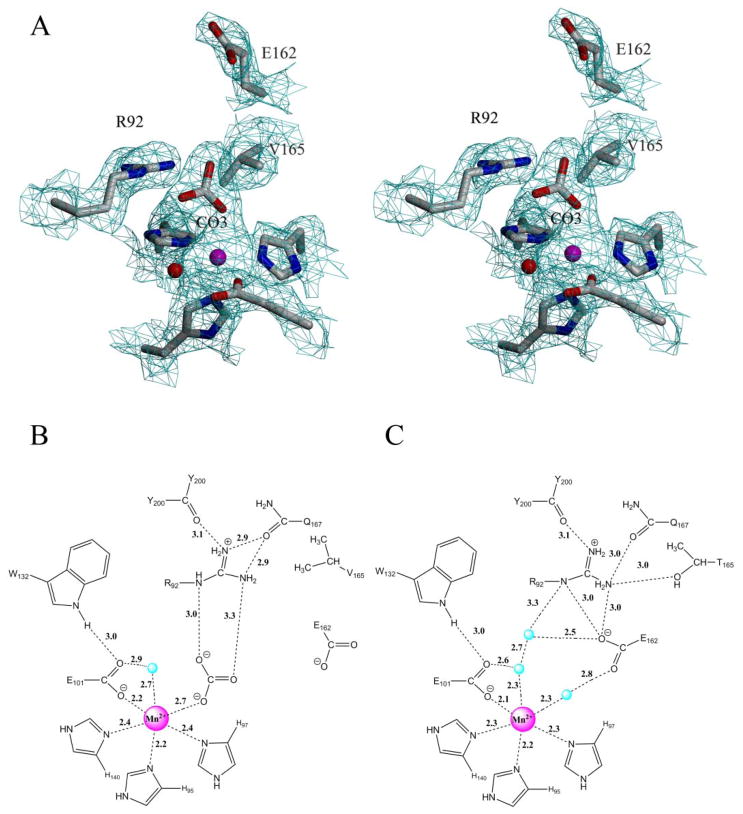
Fig. 4.
(A) Stereo view of the N-terminal active site of the T165V OxDC variant showing a simulated annealing omit map calculated with coefficients Fo-Fc and contoured at 1 σ (cyan cages). Mn(II) is shown as a magenta sphere and the water molecule as a red sphere. Schematic representations of the N-terminal active site of (B) the T165V OxDC variant with bound CO32− and (C) WT OxDC with the SENS loop in the “closed” conformation (1UW8) (4). In both images, Mn(II) is shown as a magenta sphere, water molecules are shown as blue spheres, and distances are given in Å.

