
Figure 5. Decreased LXRα expression in alternatively differentiated macrophages.
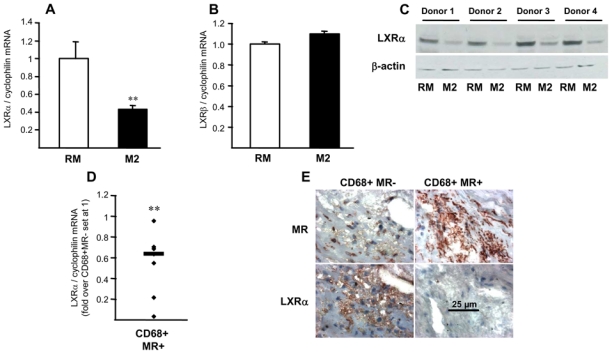
Panels A,B. Q-PCR analysis of LXRα (A) and LXRβ (B) in RM and M2 macrophages. mRNA levels were normalized to cyclophilin mRNA and expressed as means ± SD relative to RM set at 1 from three independent experiments. Statistically significant differences are indicated (t-test; *p< 0.05, **p< 0.01).
Panel C. LXRα protein expression analyzed by western blot in RM and M2 macrophages isolated from 4 different donors.
Panel D. Q-PCR analysis of LXRα performed on RNA from LCM-isolated CD68+MR− and CD68+MR+ macrophage-rich areas isolated from 7 samples. mRNA levels were normalized to cyclophilin mRNA and expressed relative to the levels in CD68+MR− area set at 1. Each point corresponds to a single atherosclerotic plaque. The median value is shown. Statistically significant differences are indicated (t-test; **p< 0.01).
Panel E. MR and LXRα immunostaining performed in human carotid atherosclerotic lesions. Scale bar is shown.