
Figure 6. Decreased LXRα activity in M2 macrophages.
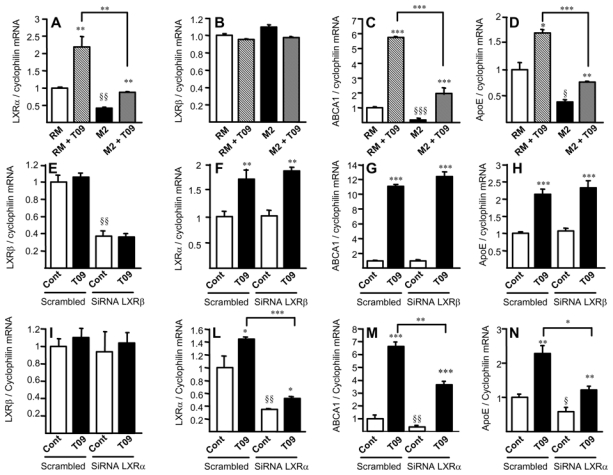
Panels A–D. Q-PCR analysis of LXRα (A), LXRβ (B), ABCA1 (C) and ApoE (D) in RM or M2 macrophages treated or not with T0901317 (T09). mRNA levels were normalized to cyclophilin mRNA and expressed as means ± SD relative to RM set at 1 from three independent experiments. Statistically significant differences are indicated (t-test; RM vs M2 § p< 0.05, §§ p< 0.01, §§§ p< 0.001; and T09 treated vs control **p< 0.01, ***p< 0.001). Panels E–N. Q-PCR analysis of LXRβ, LXRα, ABCA1 and ApoE in M2 macrophages transfected with non-silencing control (scrambled), LXRβ siRNA (E–H) or LXRα siRNA (I–N) and treated or not with T0901317 (T09). Results were normalized to cyclophilin mRNA and expressed relative to the levels in control-siRNA transfected cells set at 1 (mean ± SD of two independent experiments). Statistically significant differences are indicated (t-test; siRNA vs scrambled §p<0.05, §§p<0.01, T09-treated vs control *p<0.05, **p<0.01, ***p<0.001).