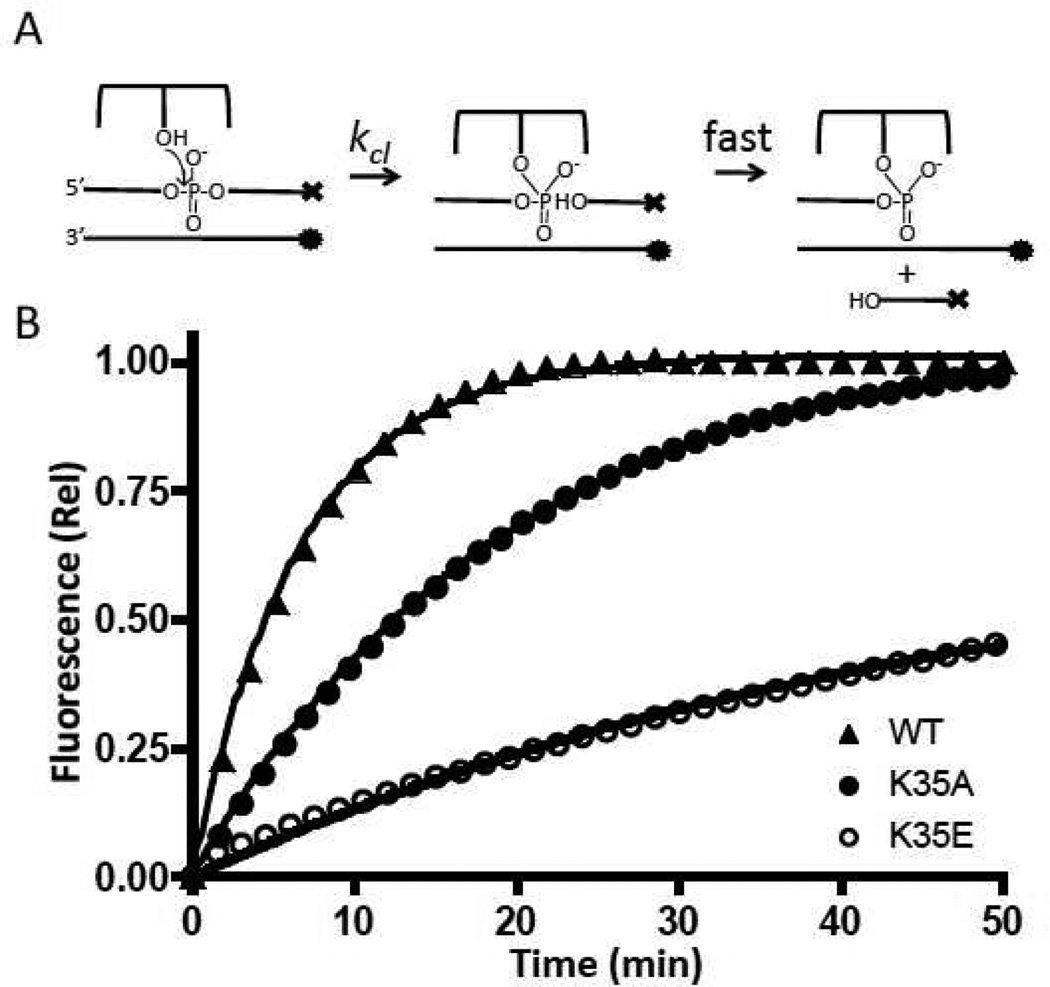
Figure 4.
DNA cleavage kinetic measurements. (A) Reaction to be measured; ⊤ represents dabcyl and • represents fluorescein. (B) Normalized fluorescence intensities as a function of time. The curves were fitted to a single exponential equation. For clarity, only one of every ten data points is plotted.

